

Some believe that geography is boring or ‘dry’, and think that looking at a map will never catch their interest. Well, chances are that their mindset can be changed with the maps on today’s list.
Created by the mastermind behind the ‘Very Useful Maps’ account, these images are not your regular markers of geographic areas; they are mirrors of cultural phenomena, eating habits, all things nature, and so much more, so scroll down to find them and see for yourself just how amusing and fun geography can be.
If you scroll down, you will also find Bored Panda’s interview with assistant professor of geography at University of Oregon and an academic expert in climate change communication, cartography, map design and mapping environment-society interactions, Carolyn Fish, who was kind enough to delve deeper into the topic of maps with us.
#1
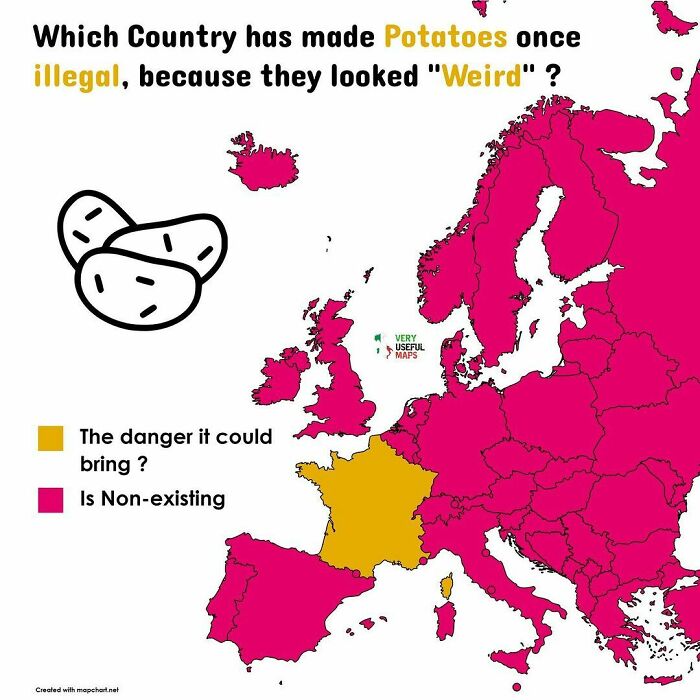
Image credits: very_useful_maps
#2
Enter Capri, an island and popular tourist destination in Italy's Gulf of Naples. Noted as one of the world's strangest laws, it's illegal here to wear excessively noisy footwear (particularly flip flops ) as locals value their 'peace and quiet'
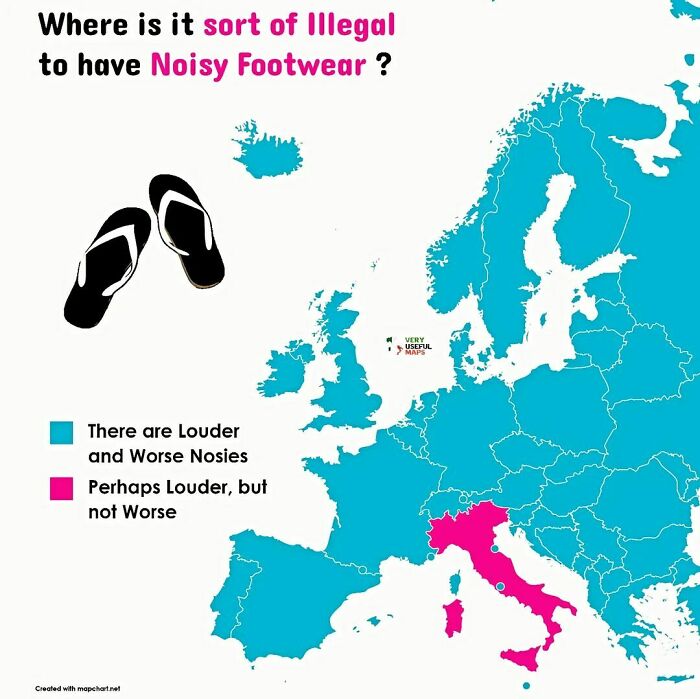
Image credits: very_useful_maps
#3
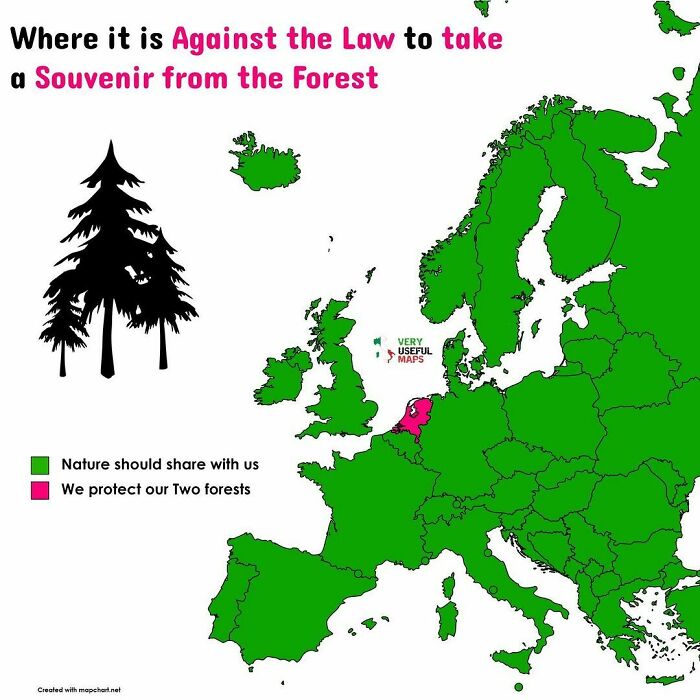
Image credits: very_useful_maps
Started in the very end of 2021, ‘Very Useful Maps’ has already amassed nearly 100k followers. In the Q&A section of the account’s Instagram highlights, the creator—a person with Czech and Italian roots—shared that there was nothing in particular that inspired them to start the account, they simply wanted to give it a go.
“I knew that map accounts existed and, well, on New Year's Eve, I decided ‘yeah, let’s do it and see how it will go’,” they wrote.
Discussing where they draw inspiration from for their maps, the mastermind behind the account revealed that it varies; sometimes an idea would pop up randomly and they would note it down for later use, but sometimes they would have to try and come up with something as they were working on the project.
“Sometimes it’s hard to come up with something, so I go for something that has been done [already], but I try to expand it,” they shared.
#4
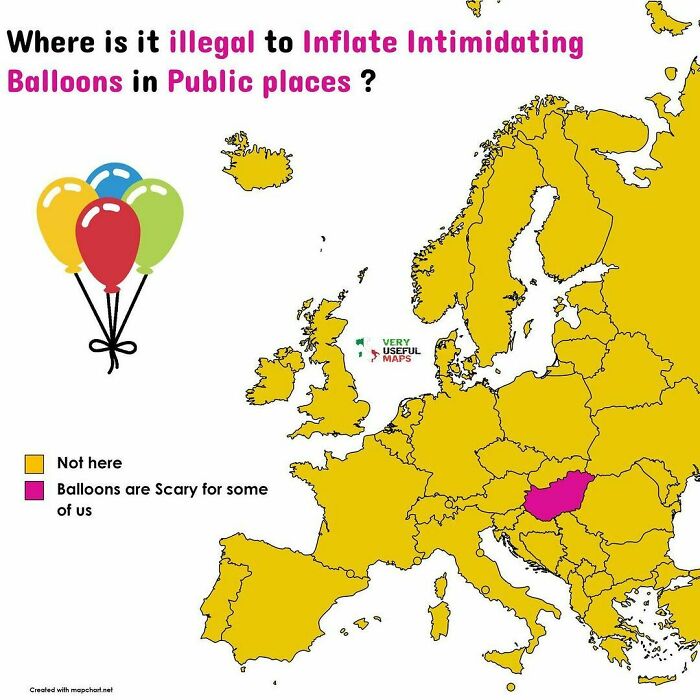
Image credits: very_useful_maps
#5
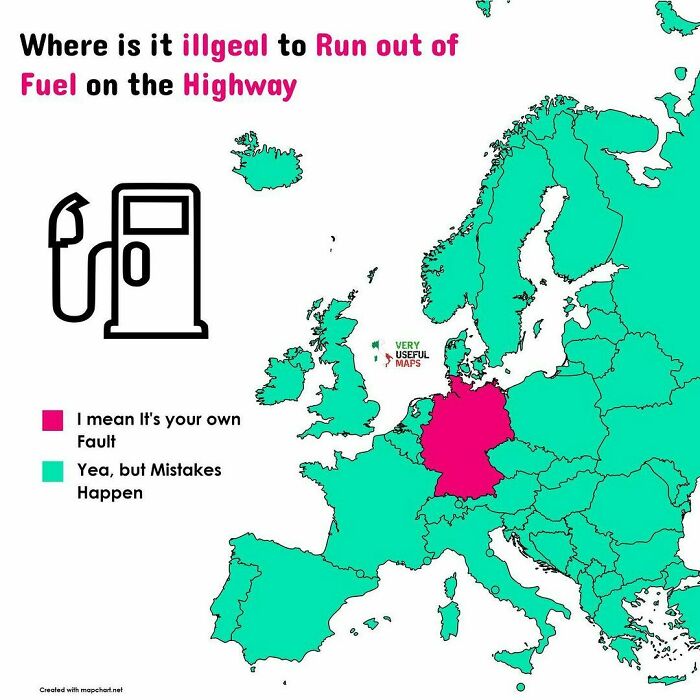
Image credits: very_useful_maps
Seeking to learn more about maps and their significance, Bored Panda turned to an academic expert in cartography, map design and mapping environment-society interactions, Carolyn Fish, who agreed to share her insight on all things maps, starting with a little bit of history.
“There are a lot of arguments about when the first maps came to be, with some scholars arguing that maps in some form have existed since ancient Mesopotamia and others arguing that they are a more recent invention that goes back still hundreds of years, but not millennia,” she told Bored Panda.
#6
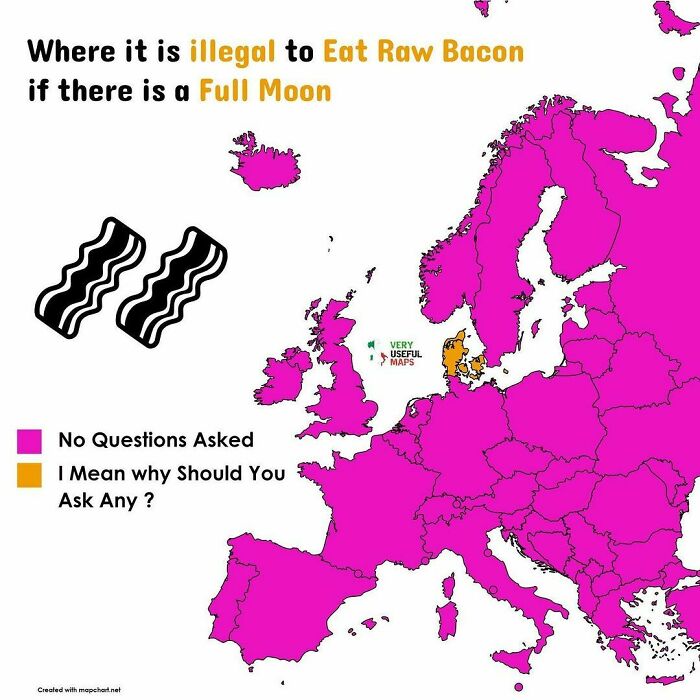
Image credits: very_useful_maps
#7
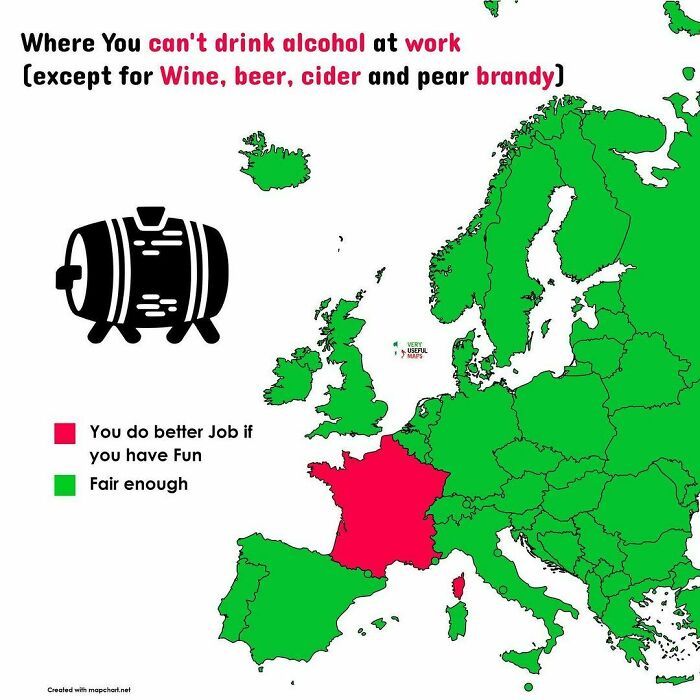
Image credits: very_useful_maps
#8
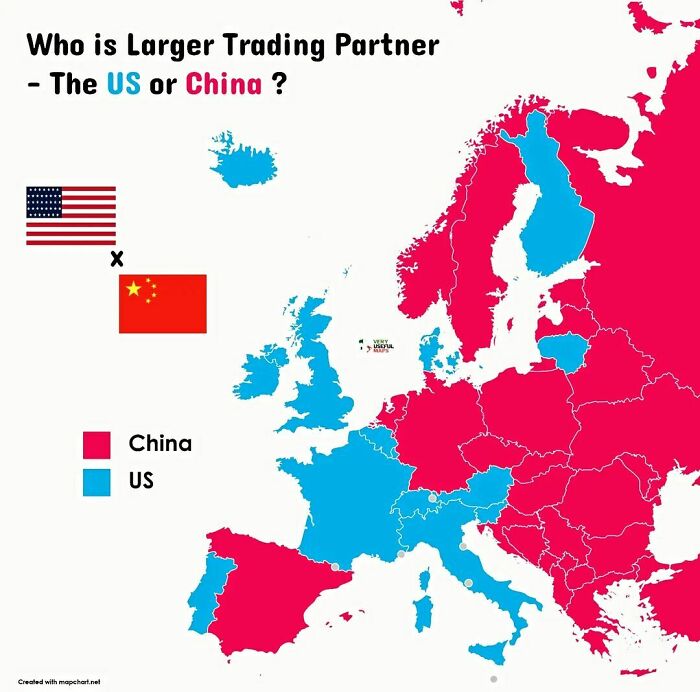
Image credits: very_useful_maps
“There are generally two types of maps: reference and thematic,” Fish continued. “The maps on the ‘Very Useful Maps’ Instagram account are thematic maps which are focused on showing data about a particular topic or theme, while reference maps are more general and are designed to help people navigate a place or identify where places are in relation to other places.
“The old road atlas you might have kept in your car, or the newer Google or Apple maps on your phone, are both examples of reference maps. Reference maps, I would argue, have existed for millennia. People have been taking their own mental maps of their world and putting that spatial information down in the dirt or later on paper for thousands of years.
“Thematic maps are considered far more recent inventions, and these maps have grown in popularity, especially in recent decades because we have access to so much data that it makes sense to represent that in a spatial form, i.e., a map,” the asst. prof. of geography explained.
#9
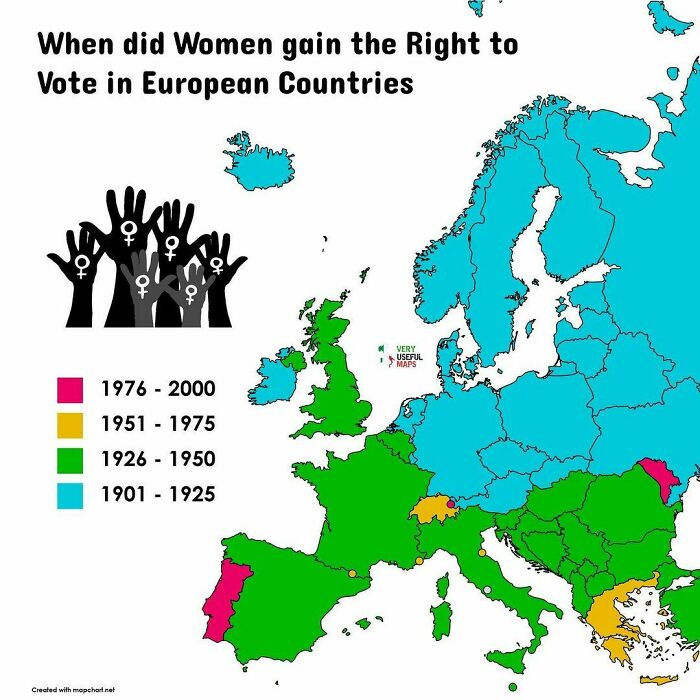
Image credits: very_useful_maps
#10
Only at Trinity college though and according to their own laws
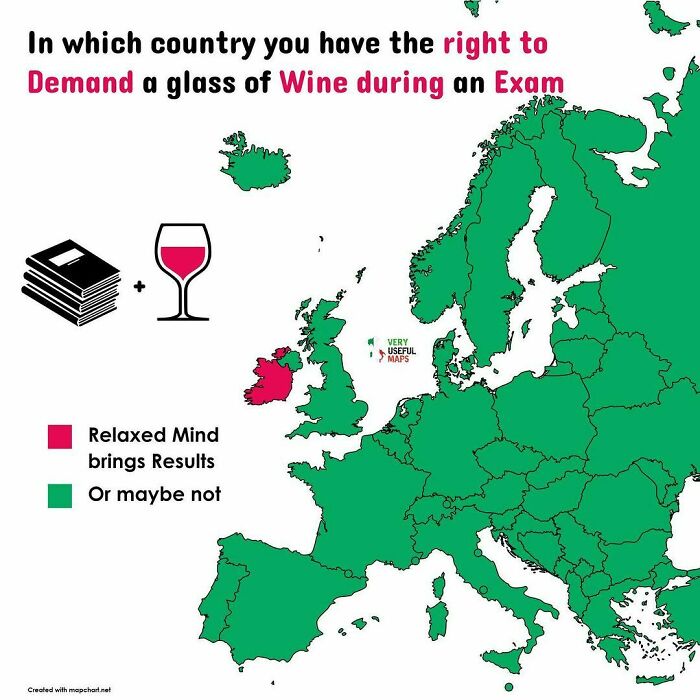
Image credits: very_useful_maps
#11
Image credits: very_useful_maps
We also discussed what makes people interested in such content as shared by ‘Very Useful Maps’, and according to the map expert, there are likely several factors at play here:
“First, the data needs to be interesting. In the ‘Very Useful Map’ Instagram account the maps are primarily of thematic data, so assuring that the data that you are showing is something people would be interested in knowing is important,” Fish suggested.
“Second, aesthetics are really important, especially on platforms like Instagram. While the platform has changed a lot over the years from moving away from static photos, the accounts that still focus on those static images have always been thinking about how aesthetics are key to getting followers. Maps can be beautiful and I think focusing on sharing beautiful maps is vital to growing a following.”
#12
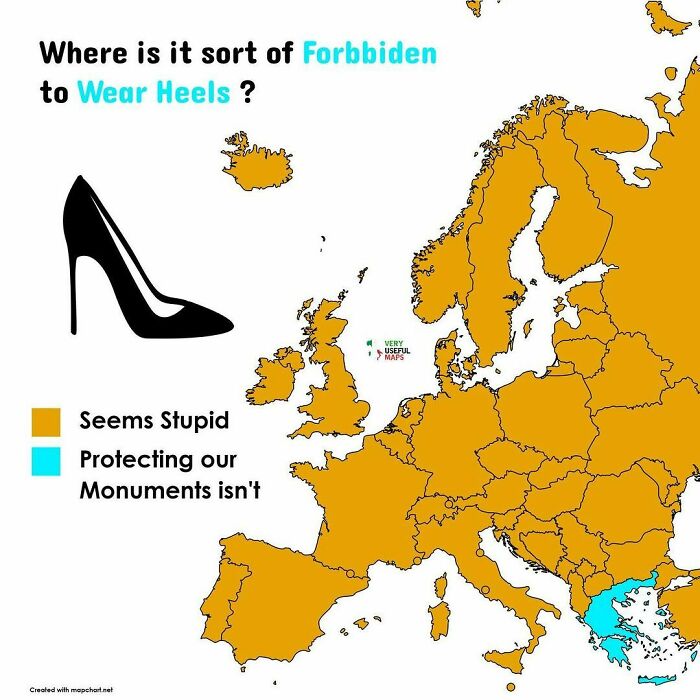
Image credits: very_useful_maps
#13
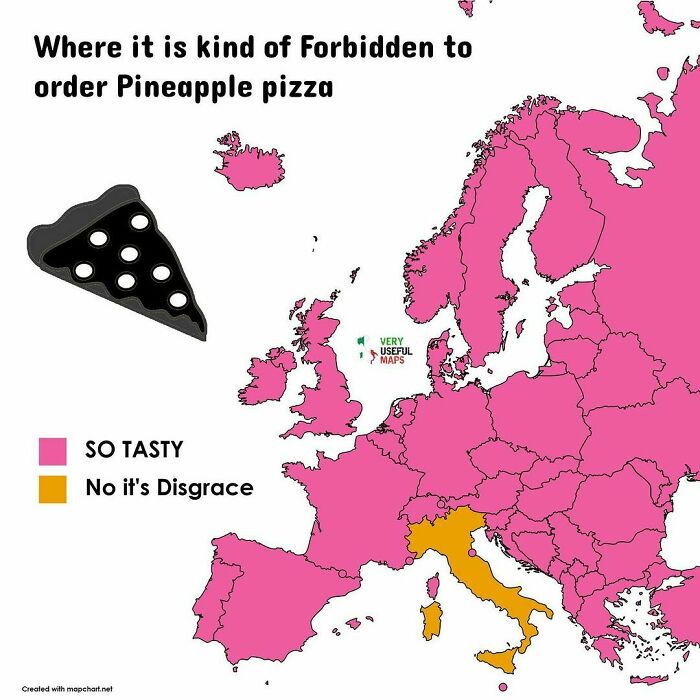
Image credits: very_useful_maps
#14
Image credits: very_useful_maps
“I’m definitely biased, but I love learning how all sorts of topics vary across space. And how something varies across space is typically best represented in a map,” Fish told Bored Panda. “I also think that one of the more interesting things to map is the connection between human geography (how things involving people vary across space) and physical geography (how the natural world varies across space). For instance, human settlement often follows natural features, and I think that is fascinating.”
#15
Image credits: very_useful_maps
#16
Image credits: very_useful_maps
#17
Image credits: very_useful_maps
“Whenever I tell people I study maps, I usually hear one of two responses. Sometimes it’s ‘Hasn’t the whole world been mapped already?’, but more often it is ‘Whoa! That’s cool! I love looking at maps!’ I think this tells me that there is a large untapped population out there who would love to follow accounts on social media that show spatial information in a beautiful way,” the expert said, addressing the popularity of map-related content online.
#18
Image credits: very_useful_maps
#19
It may sound strange, but it’s true that a driver can face a fine of 500 zlotys or even the revocation of their license if they are caught driving with contact lenses instead of glasses, despite their driver’s license indicating that they should be wearing glasses. This is because police officers can stop a driver with a significant visual impairment from driving if they don’t adhere to the restrictions on their license, which are indicated by numerical codes on the back of the document
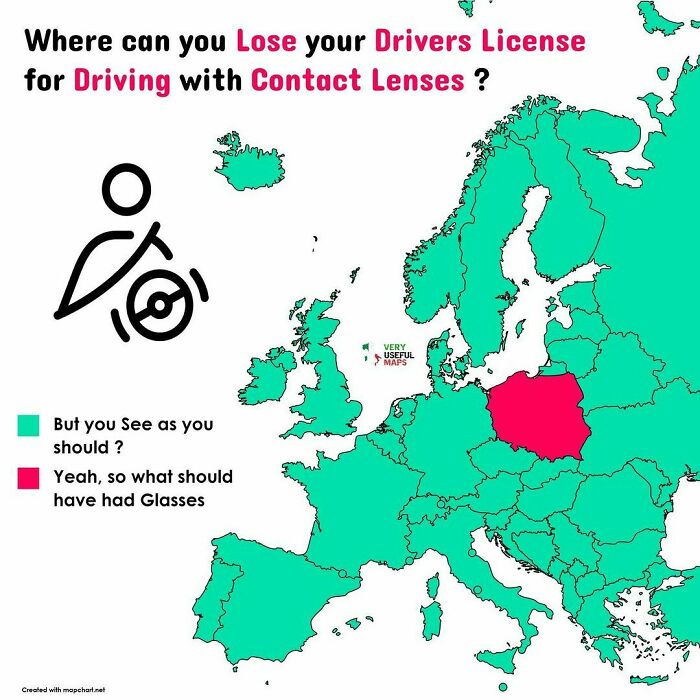
Image credits: very_useful_maps
#20
Image credits: very_useful_maps
While some of the maps on this list, such as the one depicting Europeans’ views on pineapple pizza, for instance, are more of a source of entertainment rather than geographic knowledge, information presented in fun ways can actually be a pretty great way to learn.
Thanks to technology, people nowadays have access to all sorts of engaging ways to learn new information, from games to cartoons, and beyond. While for some people, reading a book can be equally exciting, for those finding it easier to focus on something more colorful, vivid or interactive, it can be a game changer in learning.
#21
Image credits: very_useful_maps
#22
Image credits: very_useful_maps
#23
Image credits: very_useful_maps
Be it in a digital form or not, maps can help people learn not only all about certain geographic areas but about links between different cultures, too.
“While personal experience with other social groups and cultures is the pinnacle of building mutual understanding between groups, maps are a great way for people to begin to understand the world around them, including the differences (and similarities) across different cultures and groups. And getting access to maps, especially for those of us in the Global North, is easier than traveling all around the world, nevermind that it is more climate friendly,” Asst. Prof. Carolyn Fish suggested.
#24
Czech ?? taxis have three rates: the average level 1, level 2 which is usually used for tourists and level 3 which is the Government’s rate that must be used for all taxi rides after a nuclear e*plosion
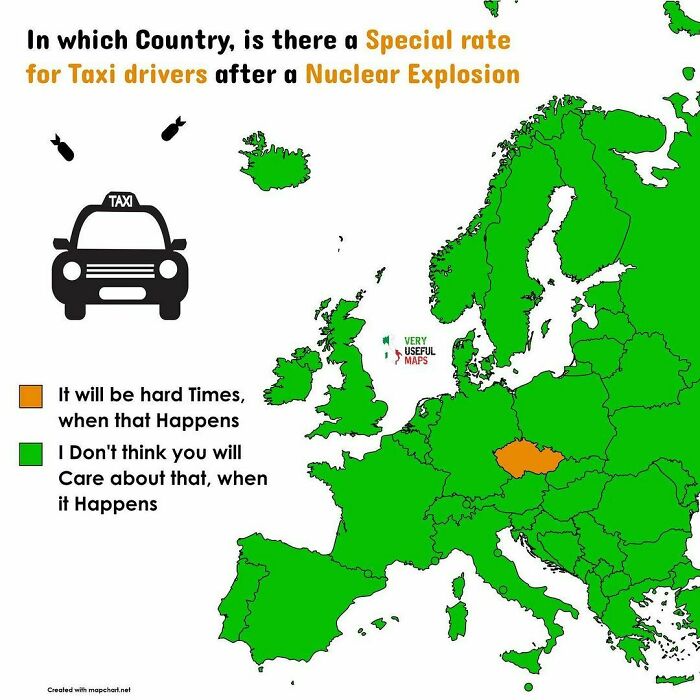
Image credits: very_useful_maps
#25
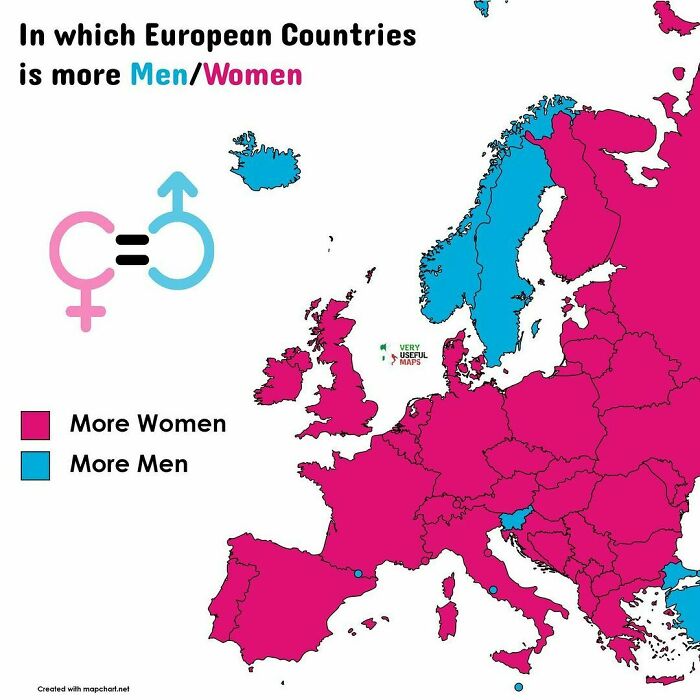
Image credits: very_useful_maps
#26
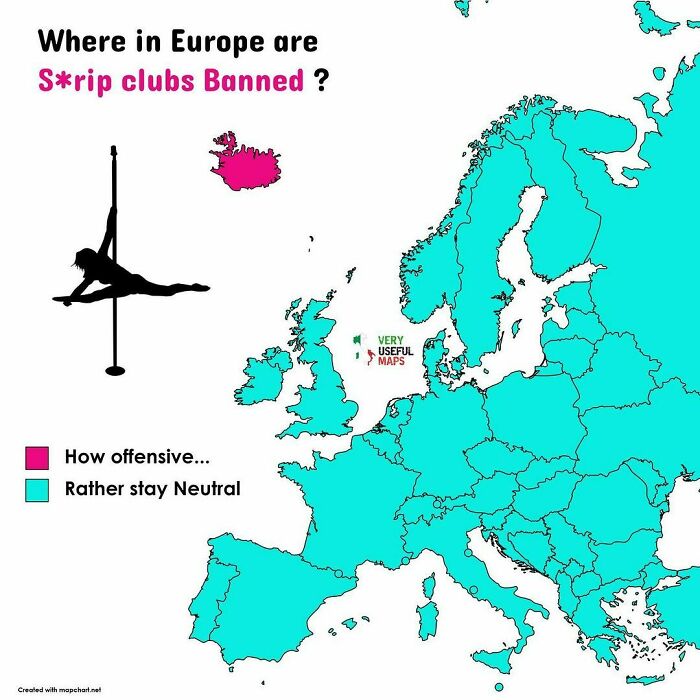
Image credits: very_useful_maps
While all sorts of maps can clearly be great ways of learning new information, according to Fish, it’s important to view them with a healthy dose of skepticism. “Just like we need to have a healthy skepticism of the news we read, we also need to maintain that skepticism with maps as well.
“There is a great book called ‘How to Lie with Maps’ by Mark Monmonier which talks about the ability to easily manipulate data and information to tell different stories in maps. A lot of my recent research has explored how people might be doing this with climate change maps. Humans have this tendency to trust maps more than they trust other information, so just being cognizant of our biases is helpful when viewing maps these days.
“My research has shown that typically there is not ill-intention on the part of the mapmaker, but we, as map readers, should all be looking at maps and thinking: about where the data comes from, who had a stake in creating it, what mistakes could have been made in the creation of the map, and how was the data made into information that is viewable in this type of graphic.”
#27
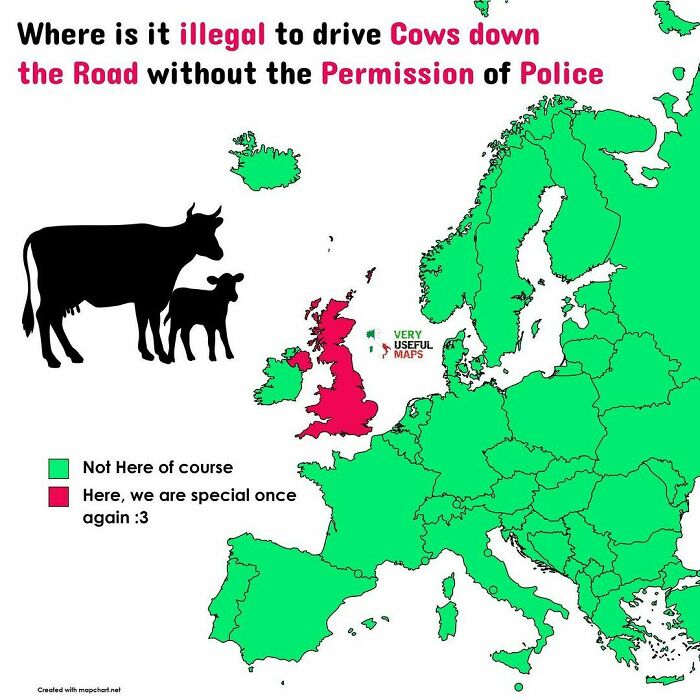
Image credits: very_useful_maps
#28

Image credits: very_useful_maps
#29
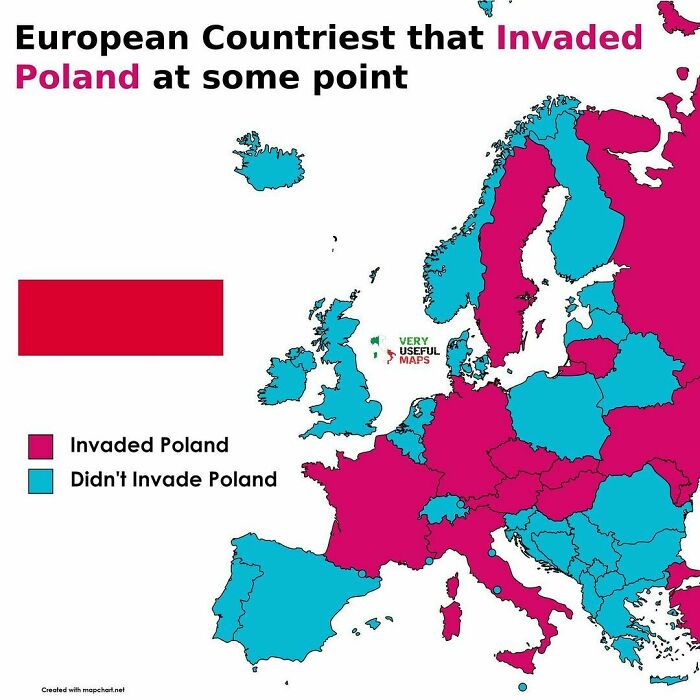
Image credits: very_useful_maps
#30
Image credits: very_useful_maps
#31
How is Cost of Living Calculated:
Cost of living is calculated by comparing the prices of a range of goods and services on which consumers spend their money.
Costs are broken down by categories, like health care, food, and housing, and weighted based on spending patterns and individual budgets
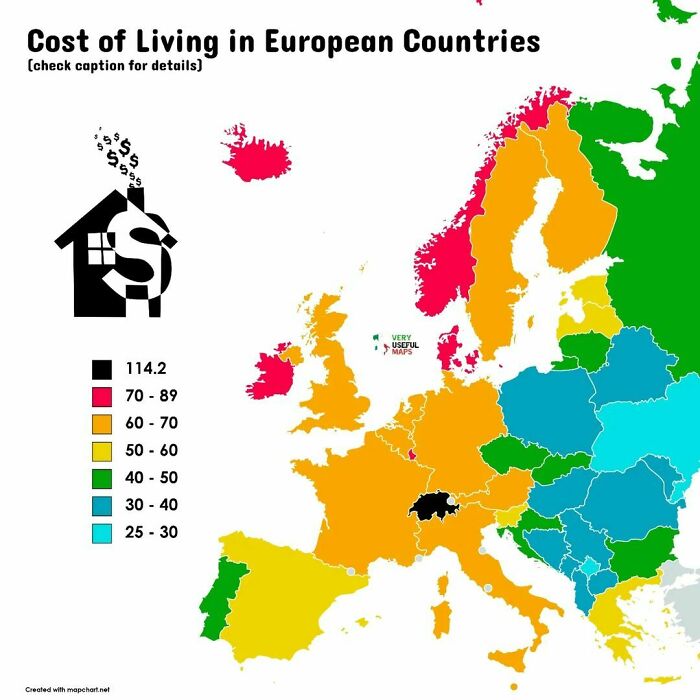
Image credits: very_useful_maps
#32
Image credits: very_useful_maps
#33
Image credits: very_useful_maps
#34
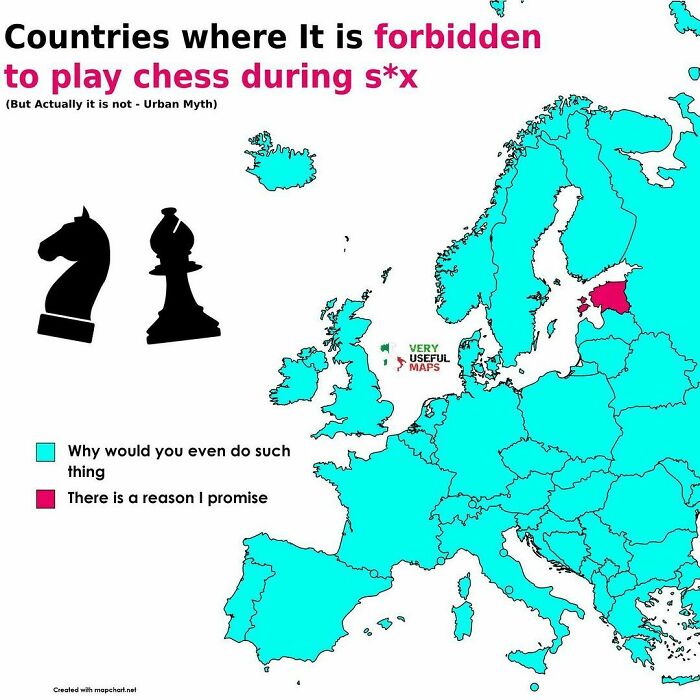
Image credits: very_useful_maps
#35
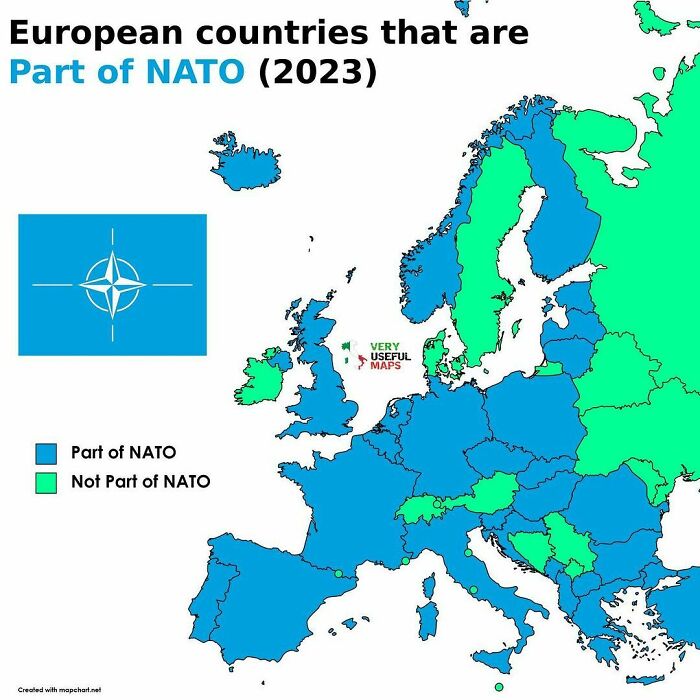
Image credits: very_useful_maps
#36
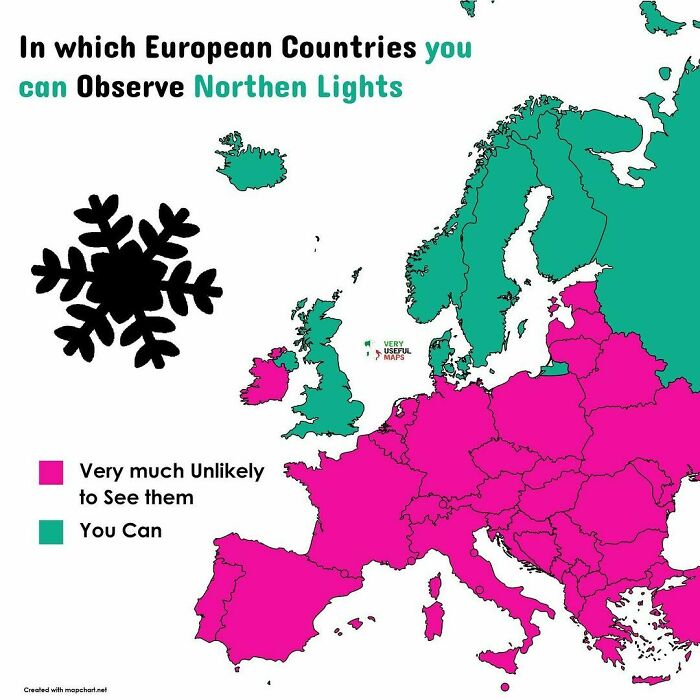
Image credits: very_useful_maps
#37
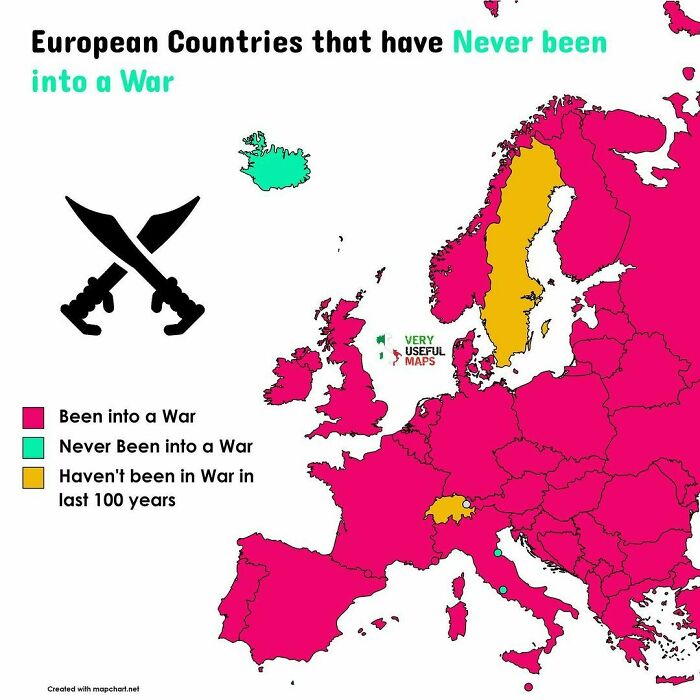
Image credits: very_useful_maps
#38
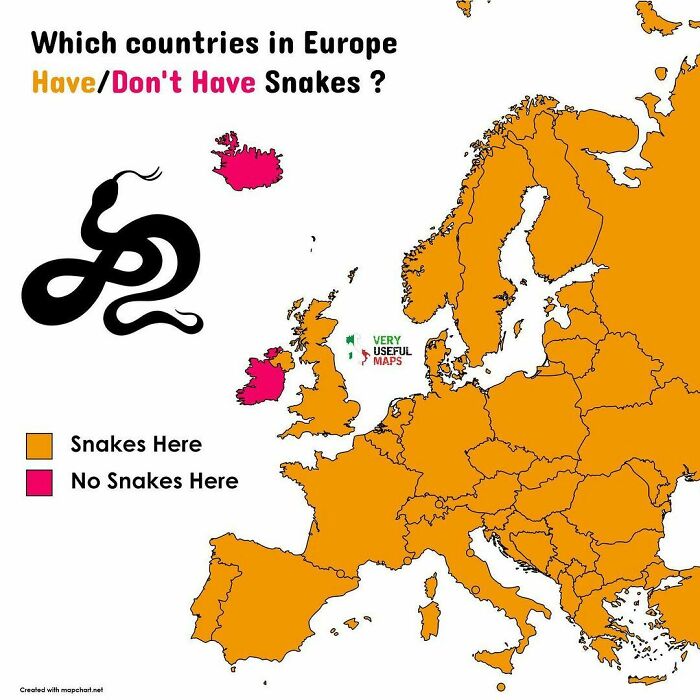
Image credits: very_useful_maps
#39
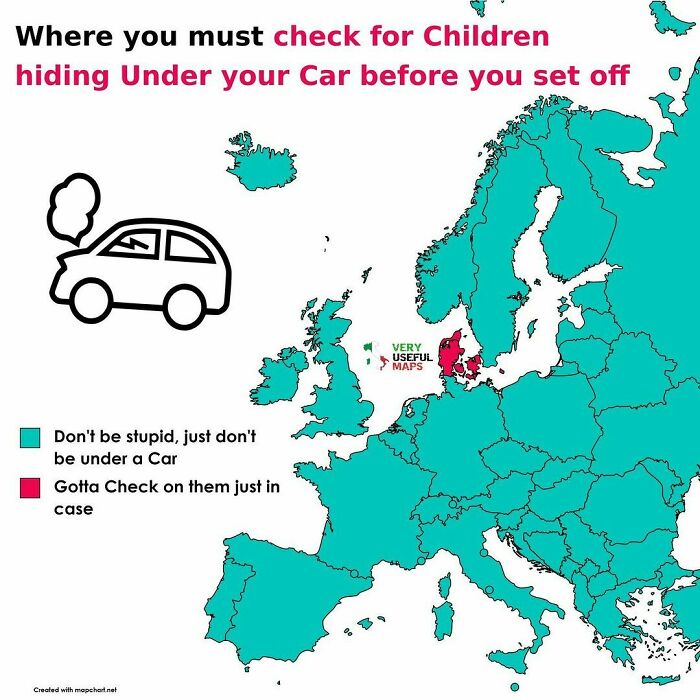
Image credits: very_useful_maps
#40
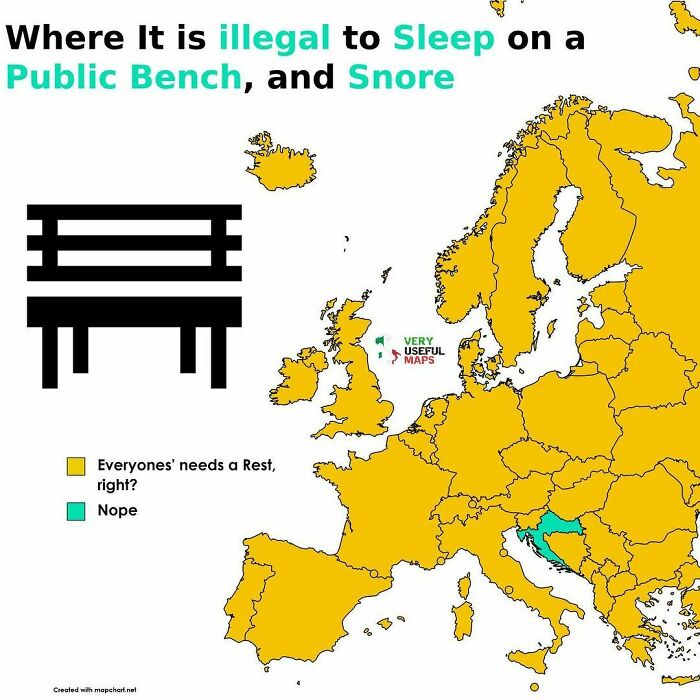
Image credits: very_useful_maps
#41
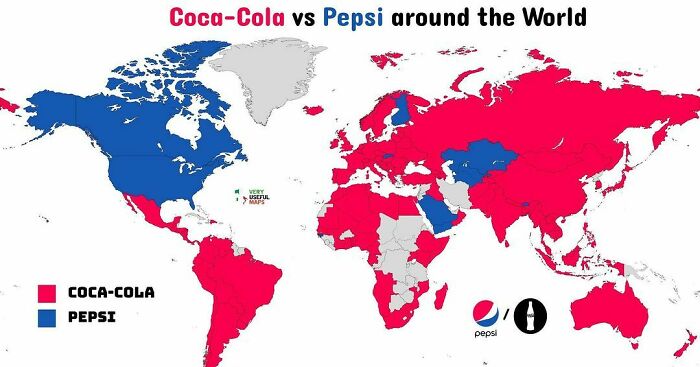
Image credits: very_useful_maps
#42
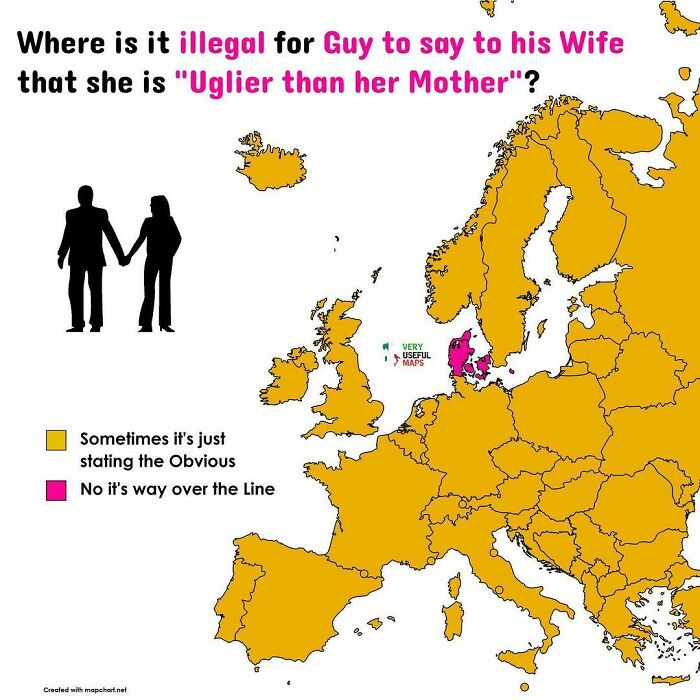
Image credits: very_useful_maps
#43
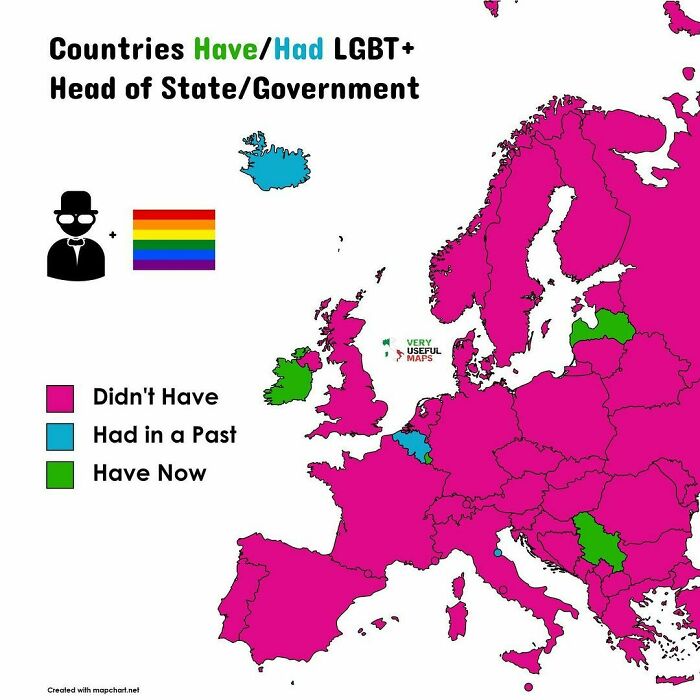
Image credits: very_useful_maps
#44
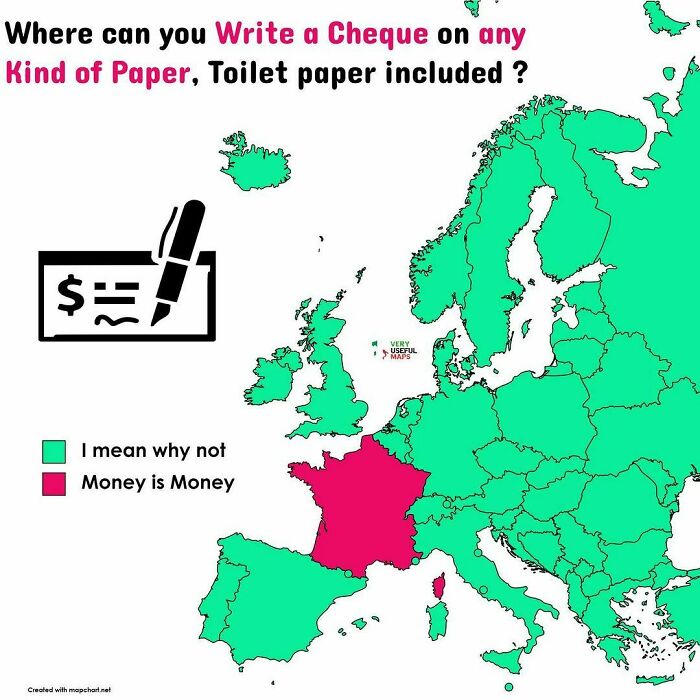
Image credits: very_useful_maps
#45
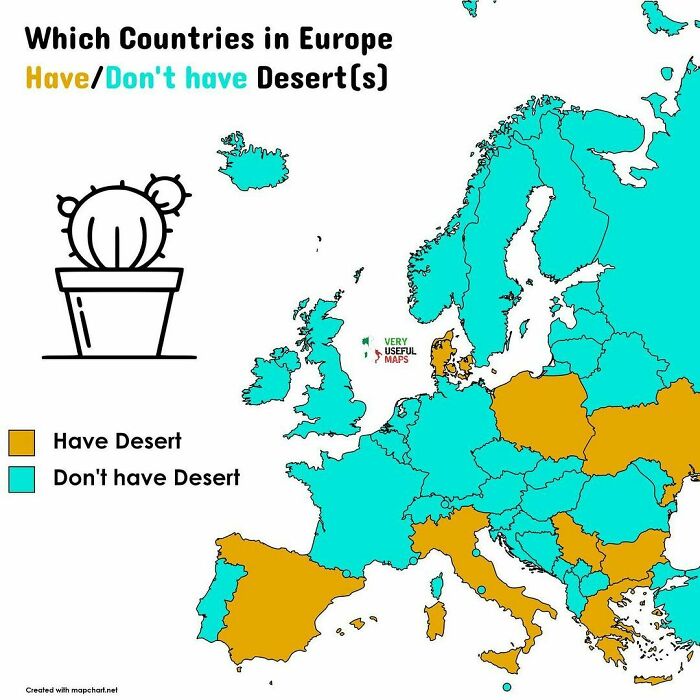
Image credits: very_useful_maps
#46
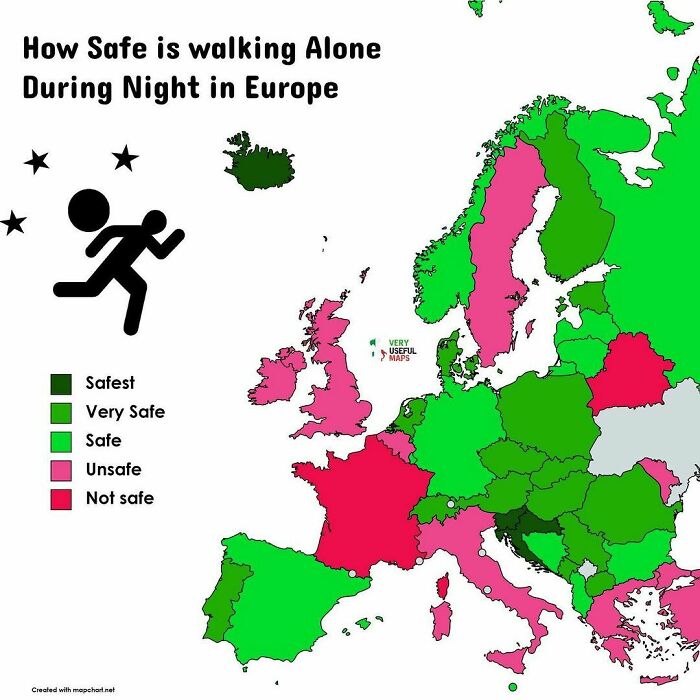
Image credits: very_useful_maps
#47
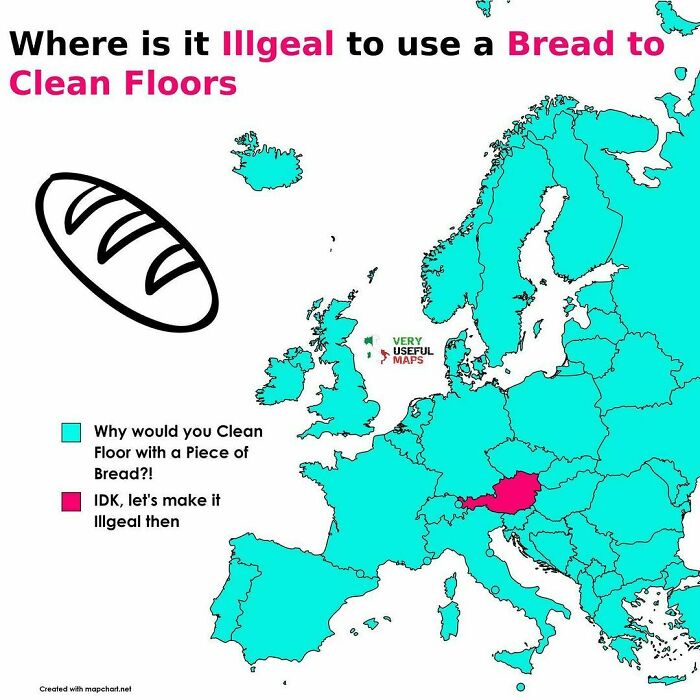
Image credits: very_useful_maps
#48
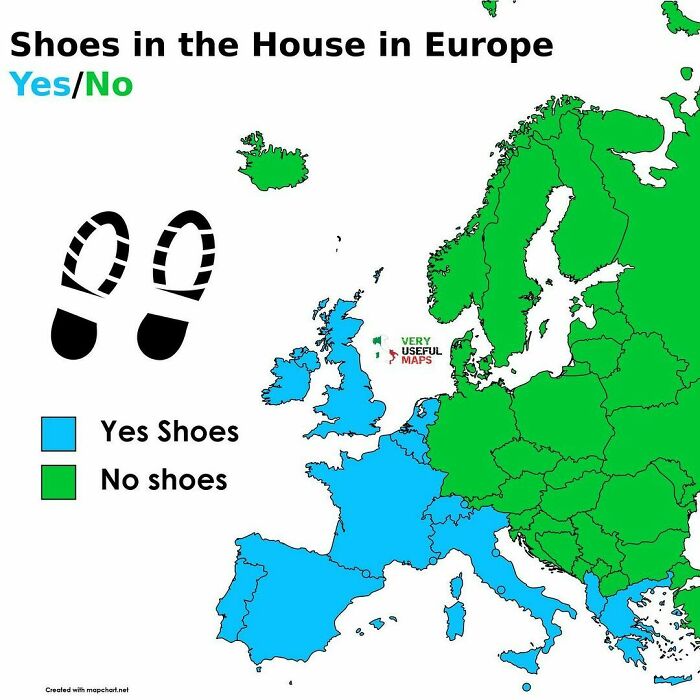
Image credits: very_useful_maps
#49
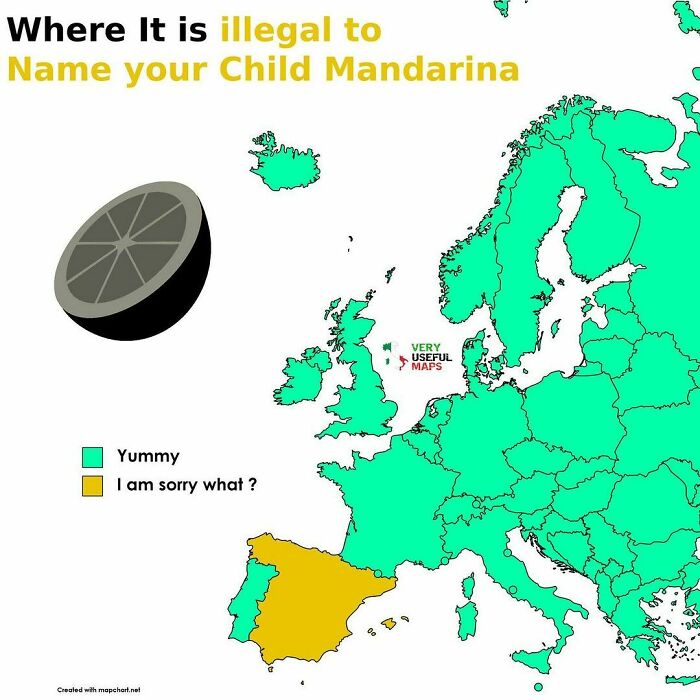
Image credits: very_useful_maps
#50
Image credits: very_useful_maps
#51
Globally in 2018, just 18.4 percent of total renewable freshwater resources were being withdrawn. Regionally though, there are already places experiencing serious issues. Northern Africa has critical water stress levels, while Central and Southern Asia were classed as having high water stress. On the other end of the scale, 31 percent of the global population remained at the “no stress” level
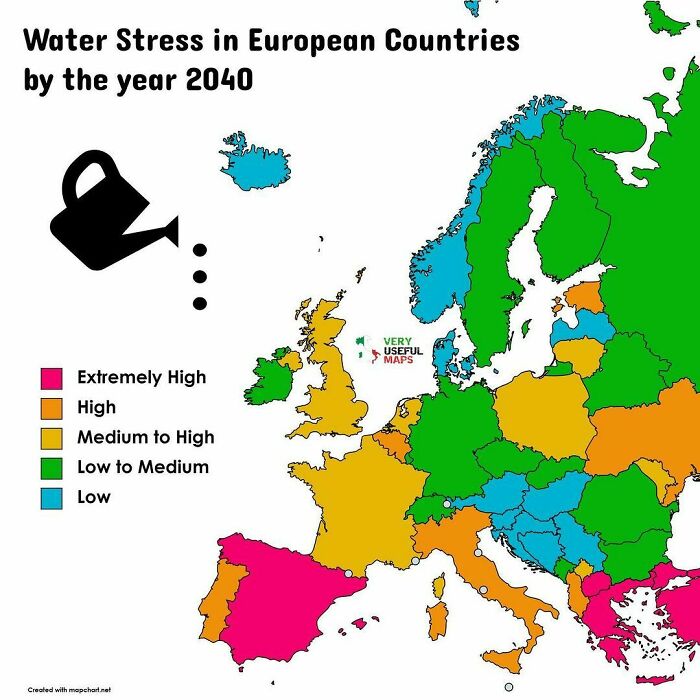
Image credits: very_useful_maps
#52
Image credits: very_useful_maps
#53
n 1995, the Albanian Parliament ?? passed a law requiring all citizens to pay taxes on traffic-lights in their home towns. You may discuss the soundness of such tax but the story goes even more absurd: once adopted, the residents of Shkodra – one of the oldest cities in Europe and the fifth largest in Albania – staged a protest. Their reason? Shkodra has no traffic lights
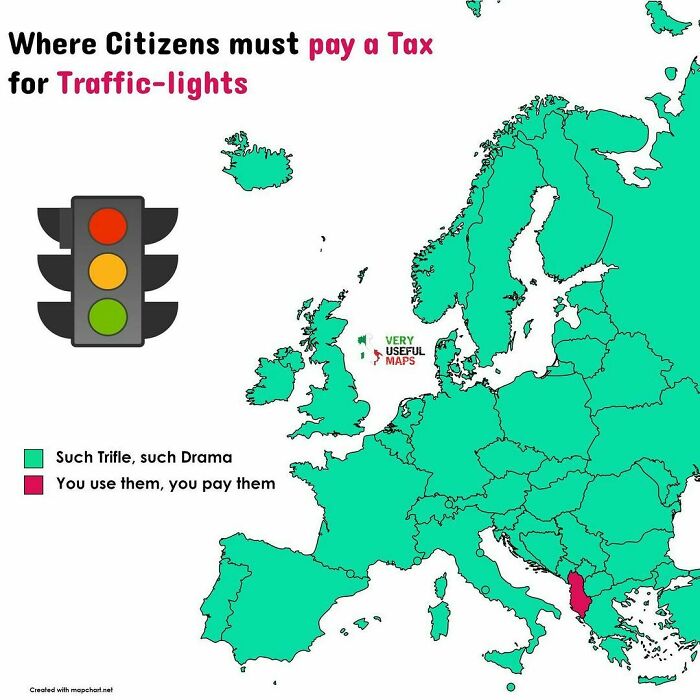
Image credits: very_useful_maps
#54
Image credits: very_useful_maps
#55
Image credits: very_useful_maps
#56
Image credits: very_useful_maps
#57
The Travel risk rating evaluates the threat posed to tourists and citizens by political violence (including terrorism, insurgency, politically motivated unrest, and war), social unrest (including sectarian, communal, and ethnic violence) as well as violent and petty crime
Other factors, such as the robustness of the transport infrastructure, the state of industrial relations, the effectiveness of the security and emergency services, and the country’s susceptibility to natural disasters are also considered where they are of sufficient magnitude to impact the overall risk environment for tourists and citizens
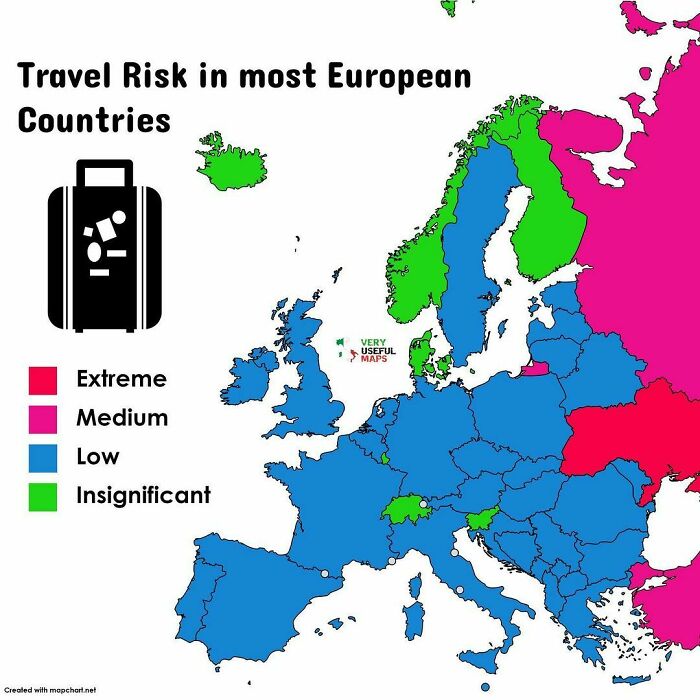
Image credits: very_useful_maps
#58
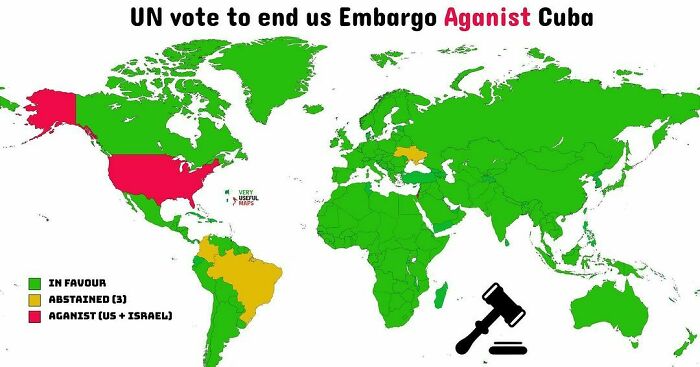
Image credits: very_useful_maps
#59
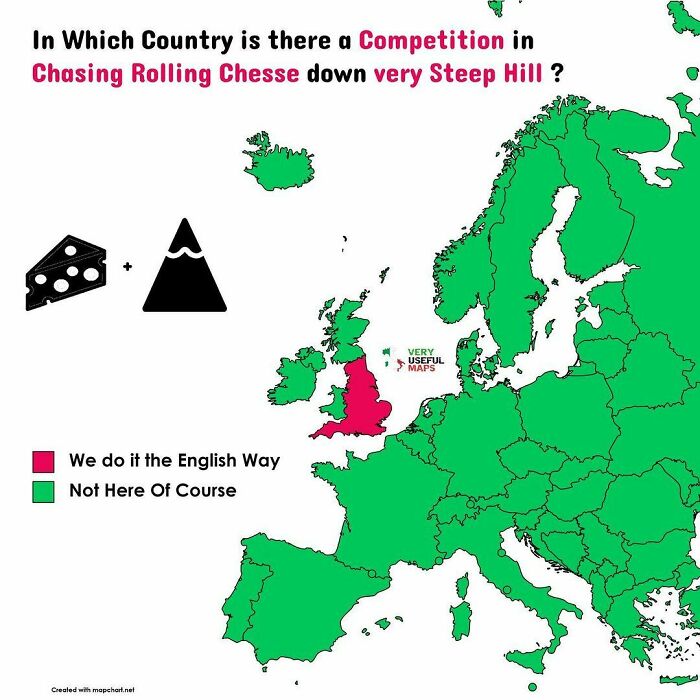
Image credits: very_useful_maps
#60
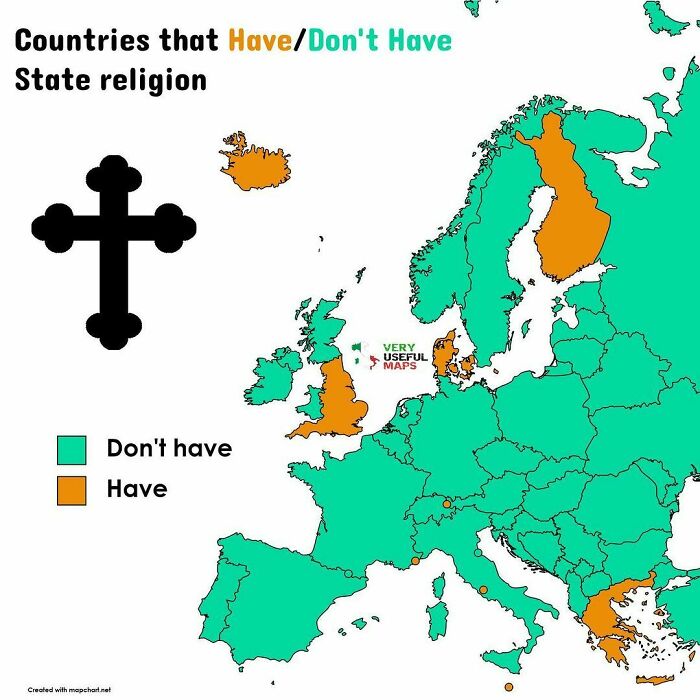
Image credits: very_useful_maps
#61
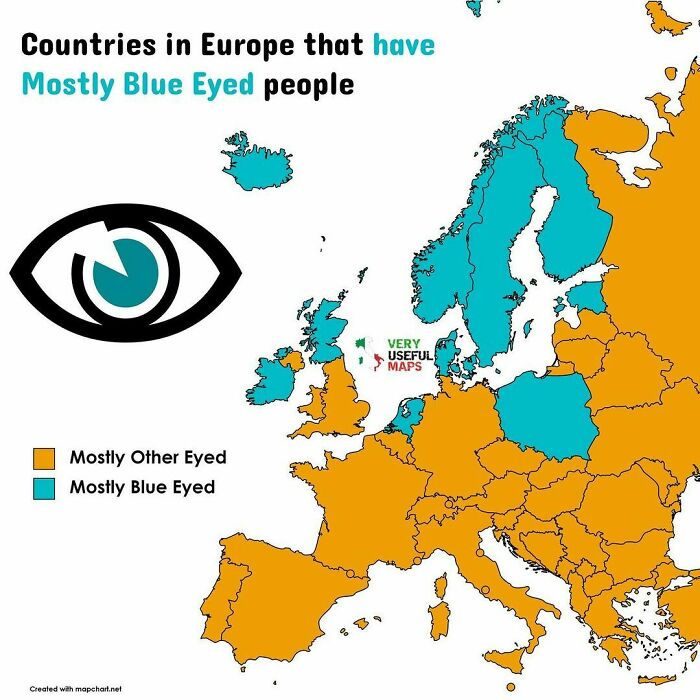
Image credits: very_useful_maps
#62
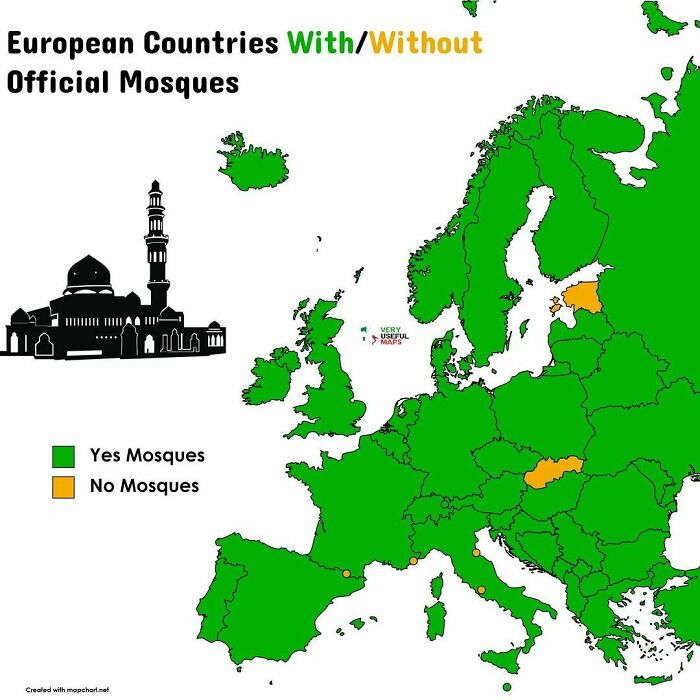
Image credits: very_useful_maps
#63
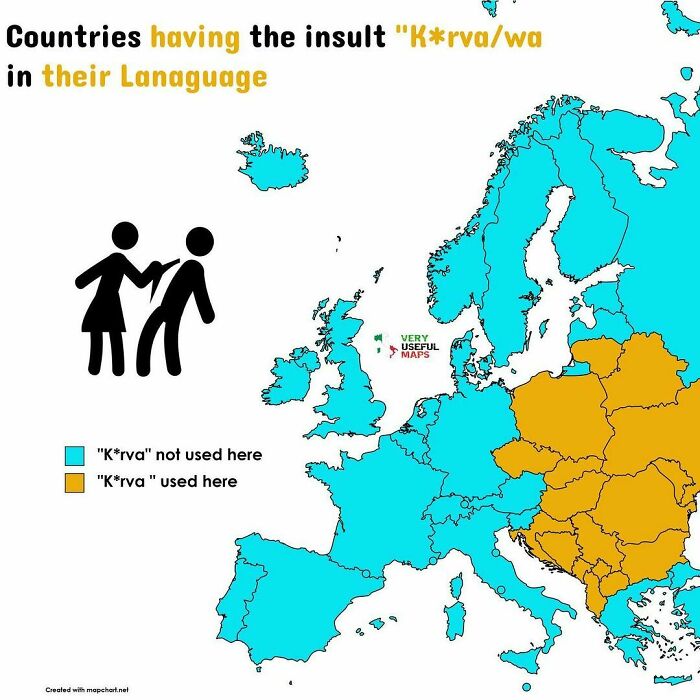
Image credits: very_useful_maps
#64
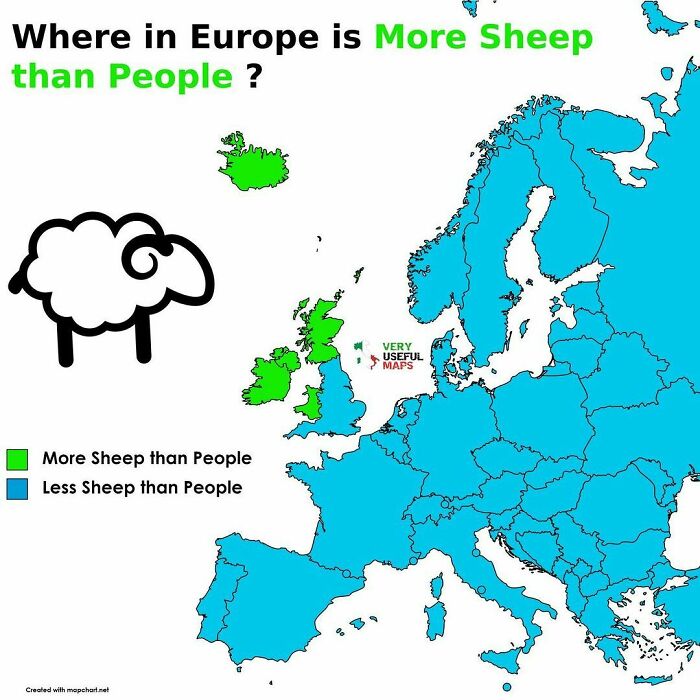
Image credits: very_useful_maps
#65
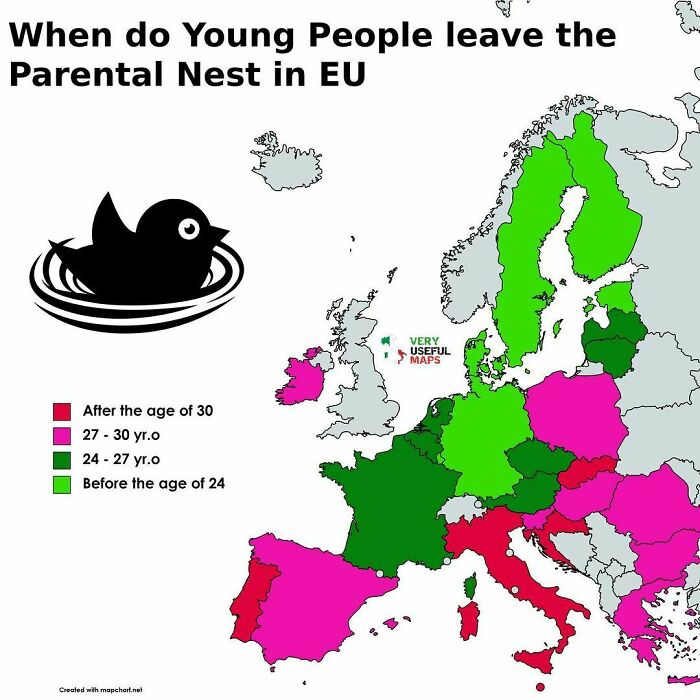
Image credits: very_useful_maps
#66
Image credits: very_useful_maps
#67
Image credits: very_useful_maps
#68
Image credits: very_useful_maps
#69
Image credits: very_useful_maps
#70
Image credits: very_useful_maps
#71
Image credits: very_useful_maps
#72
Image credits: very_useful_maps
#73
Image credits: very_useful_maps
#74
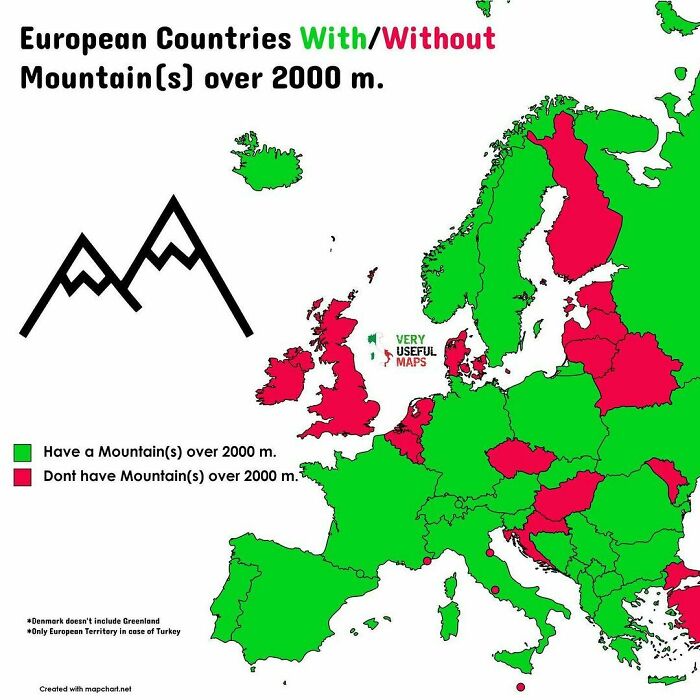
Image credits: very_useful_maps
#75
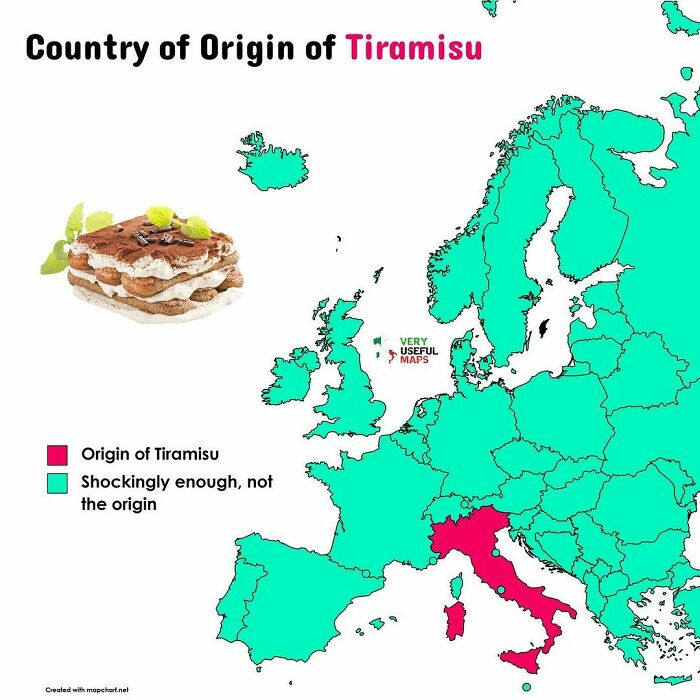
Image credits: very_useful_maps
#76
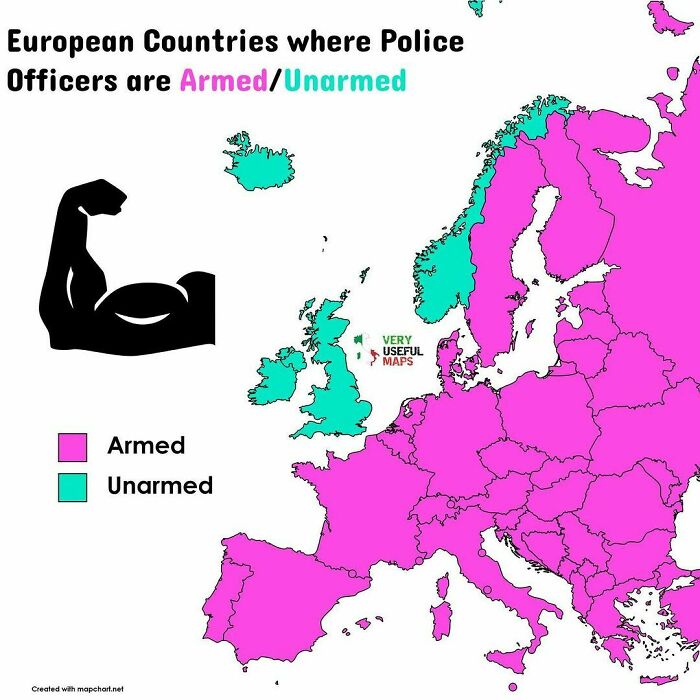
Image credits: very_useful_maps
#77
The 2022 CPI, published in January 2023, currently ranks 180 countries "on a scale from 100 (very clean) to 0 (highly corrupt)" based on the situation between 1 May 2021 and 30 April 2022. Denmark, Finland, New Zealand, Norway, Singapore, and Sweden are perceived as the least corrupt nations in the world, ranking consistently high among international financial transparency, while the most apparently corrupt are Somalia (scoring 12), Syria and South Sudan (both scoring 13)
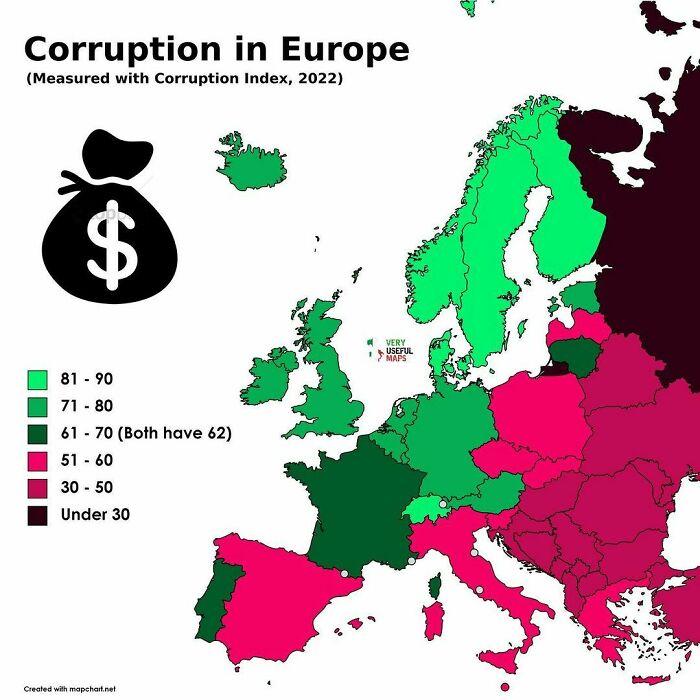
Image credits: very_useful_maps
#78
Image credits: very_useful_maps
#79
Image credits: very_useful_maps
#80
Image credits: very_useful_maps
#81
Image credits: very_useful_maps
#82
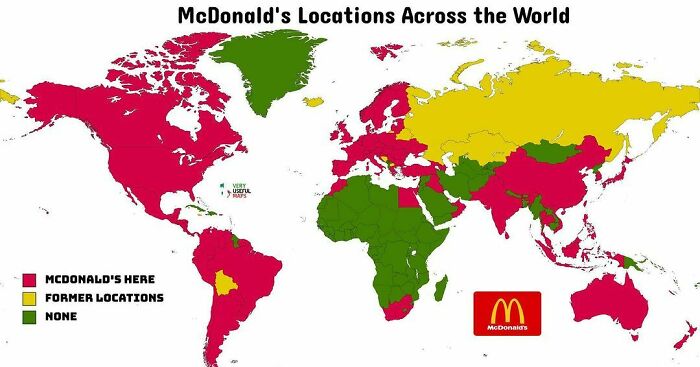
Image credits: very_useful_maps
#83
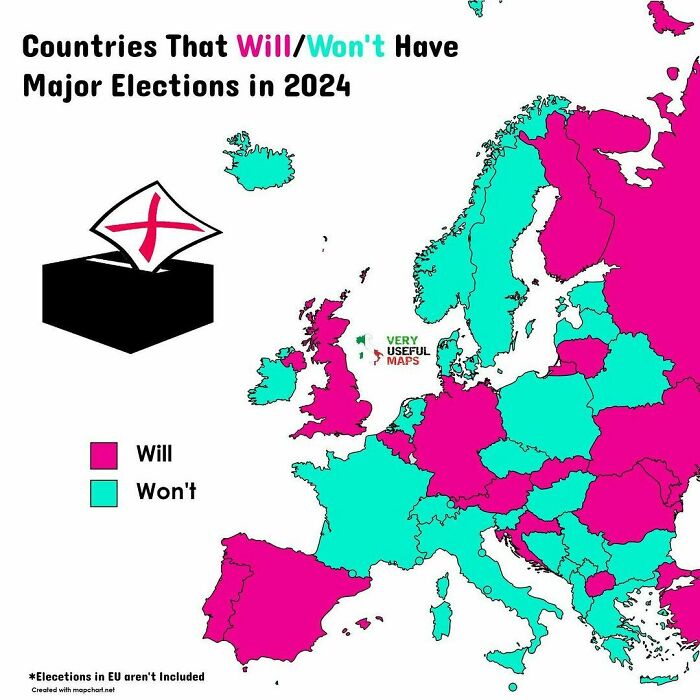
Image credits: very_useful_maps
#84
In 2022, the aftermath of C19 and the war ⚔️ in Europe brought the highest rates of global inflation since the 1990s, widespread fuel protests, and food insecurity across the developing world
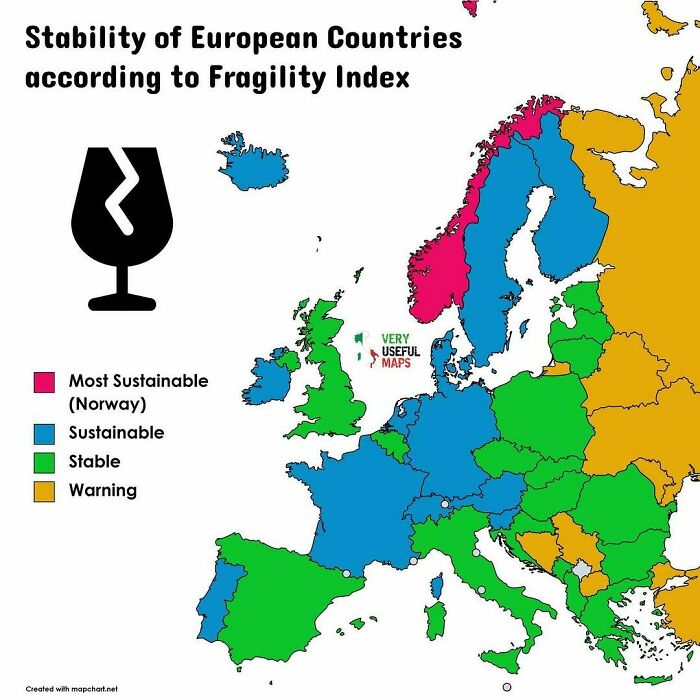
Image credits: very_useful_maps
#85
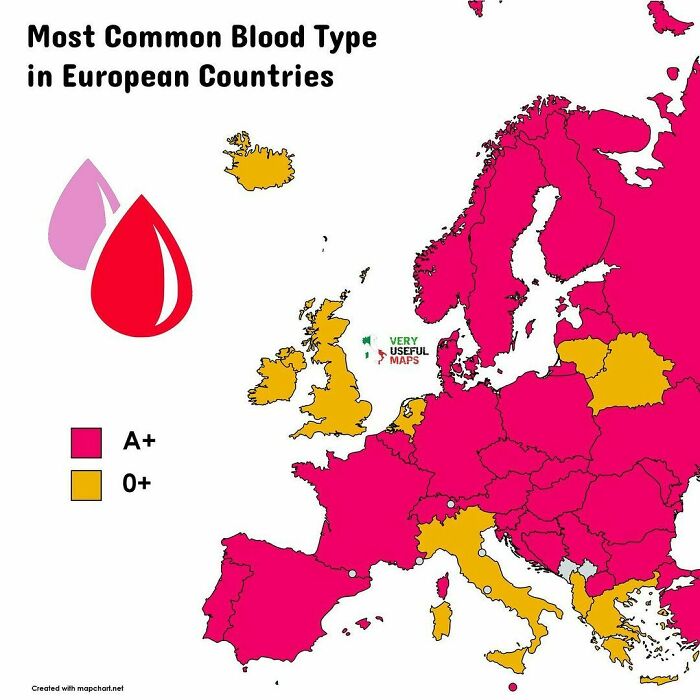
Image credits: very_useful_maps
#86
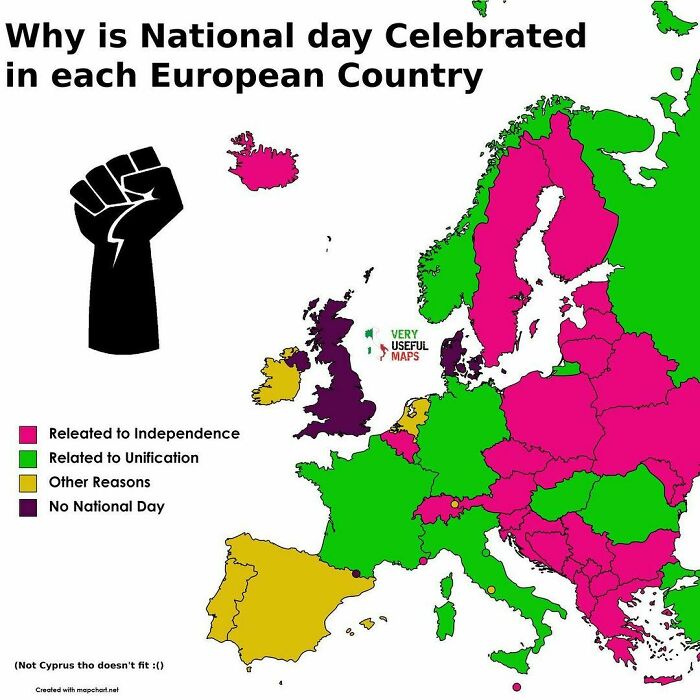
Image credits: very_useful_maps
#87
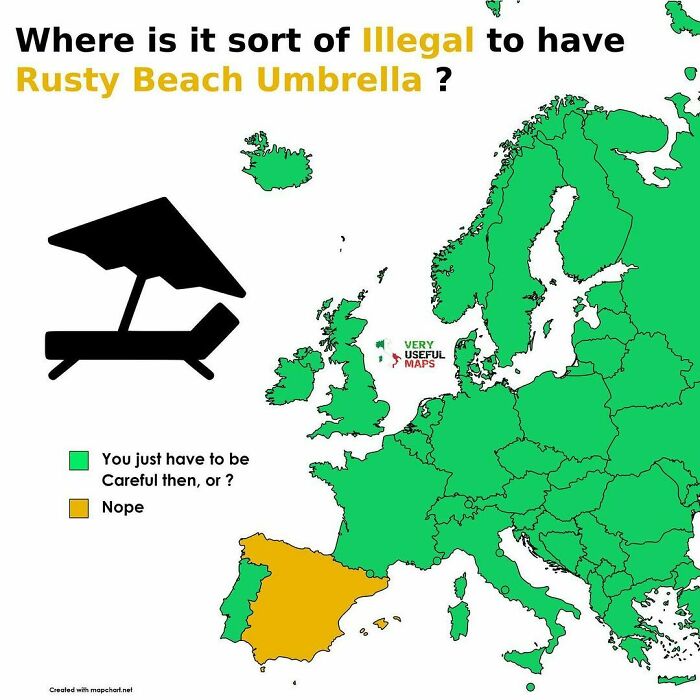
Image credits: very_useful_maps
#88
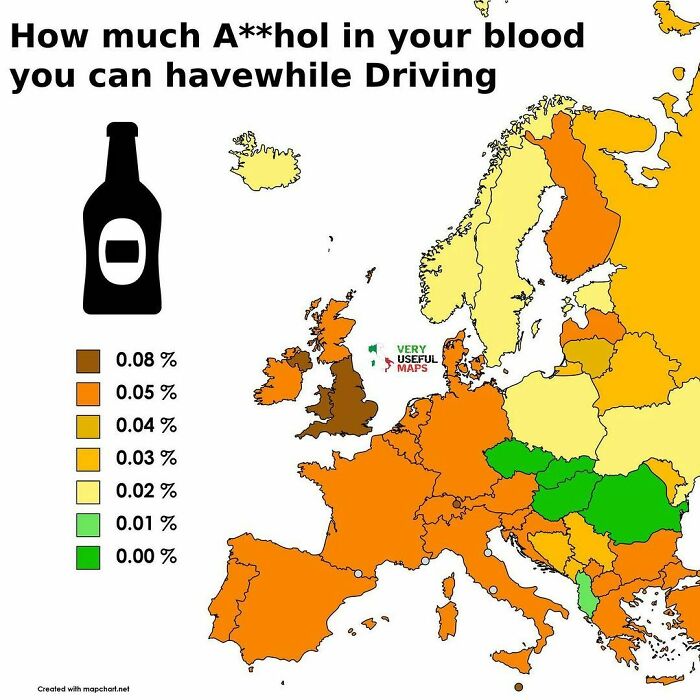
Image credits: very_useful_maps
#89
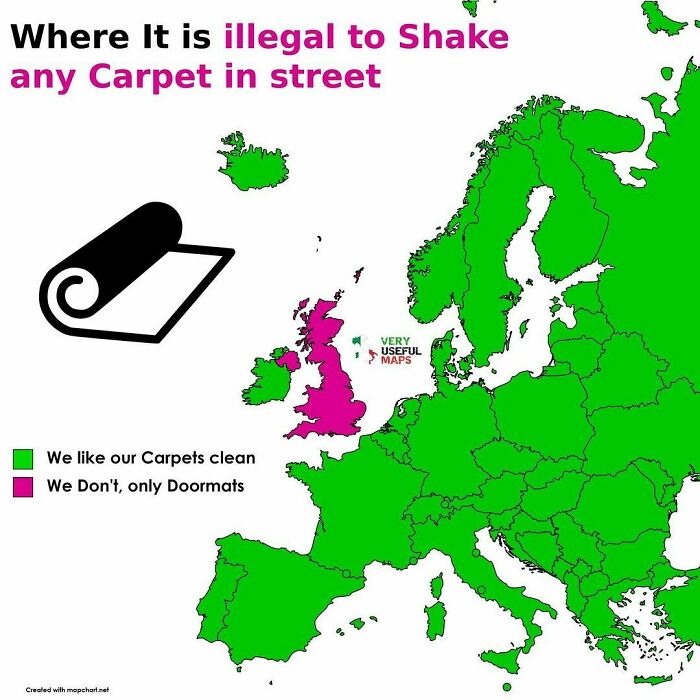
Image credits: very_useful_maps
#90
Image credits: very_useful_maps
#91
Image credits: very_useful_maps
#92
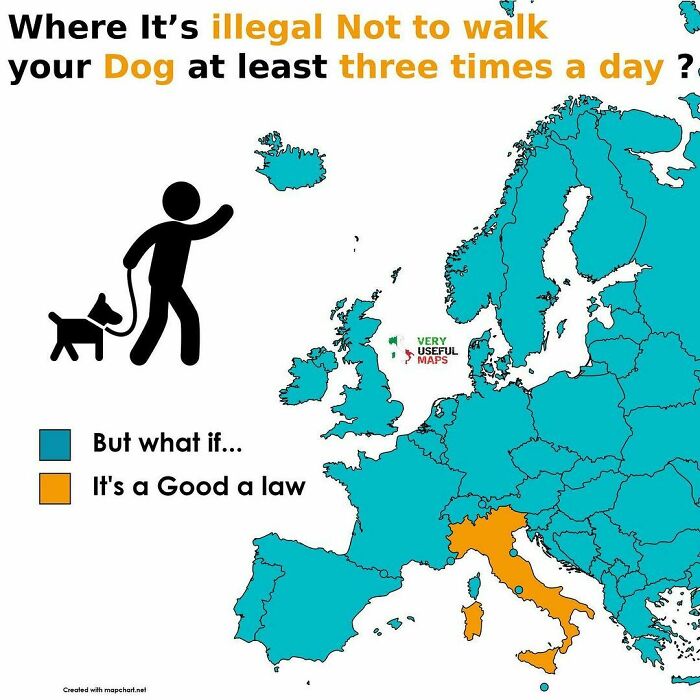
Image credits: very_useful_maps
#93
Image credits: very_useful_maps
#94
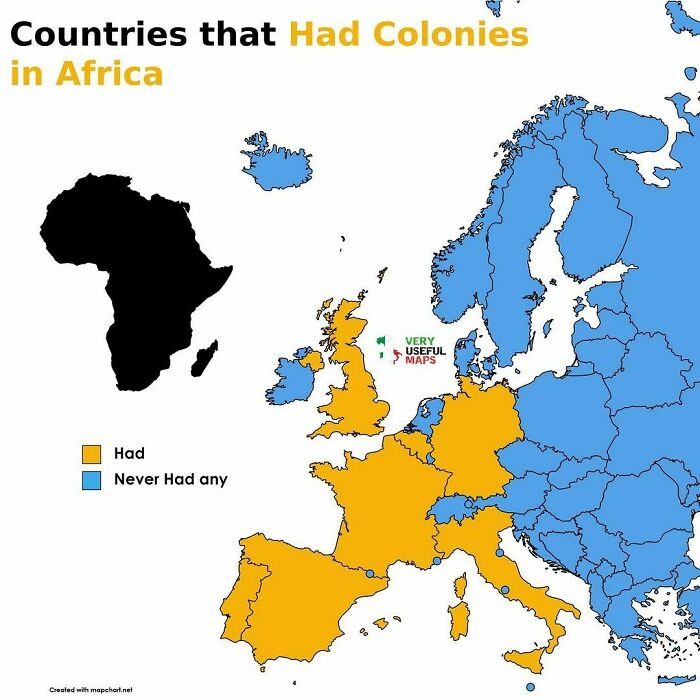
Image credits: very_useful_maps
#95
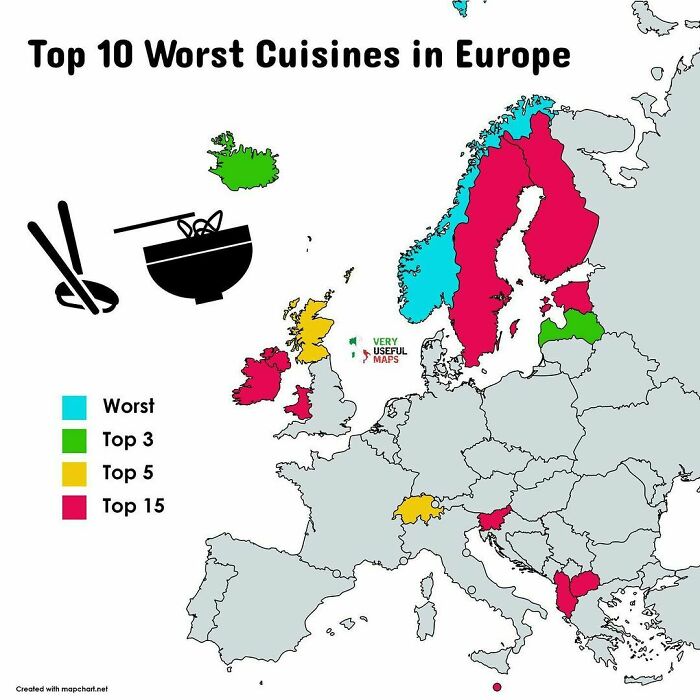
Image credits: very_useful_maps
#96
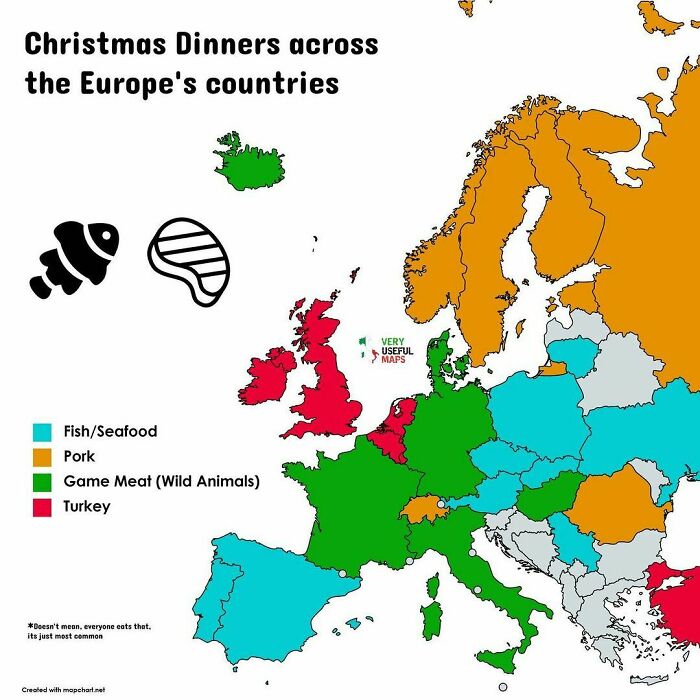
Image credits: very_useful_maps
#97
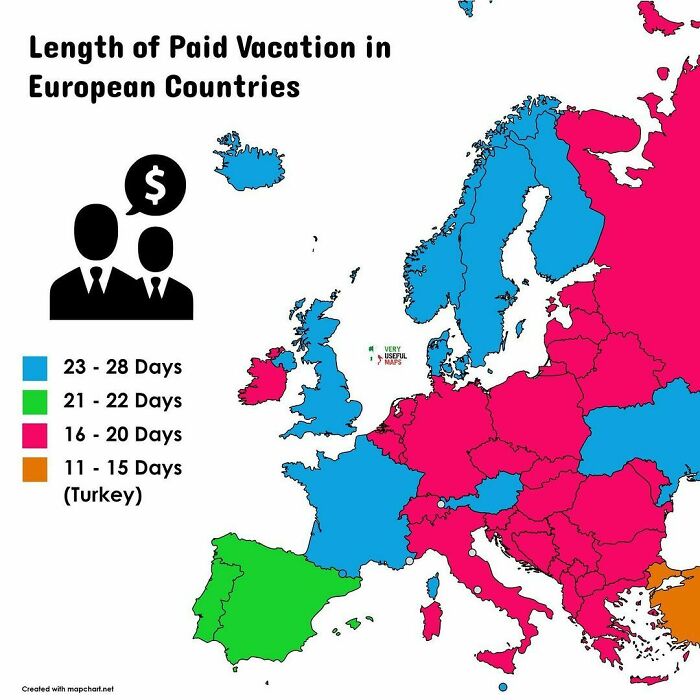
Image credits: very_useful_maps
#98
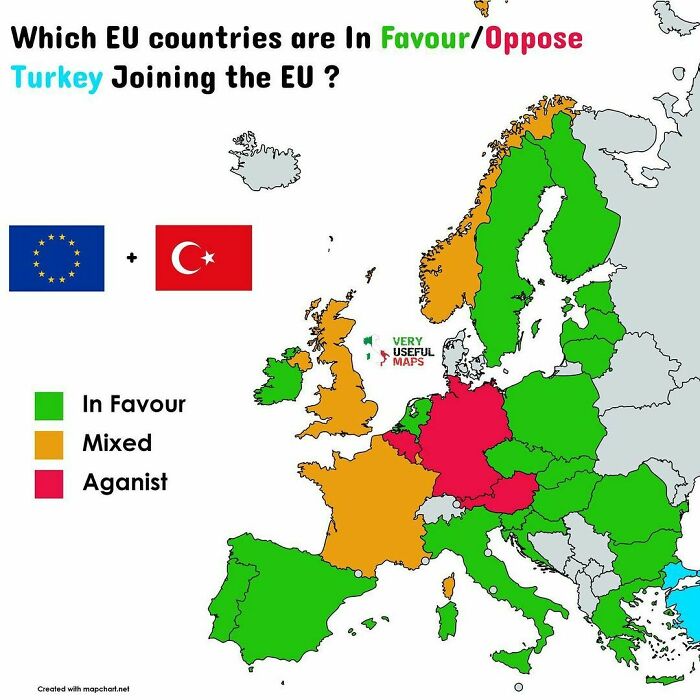
Image credits: very_useful_maps
#99
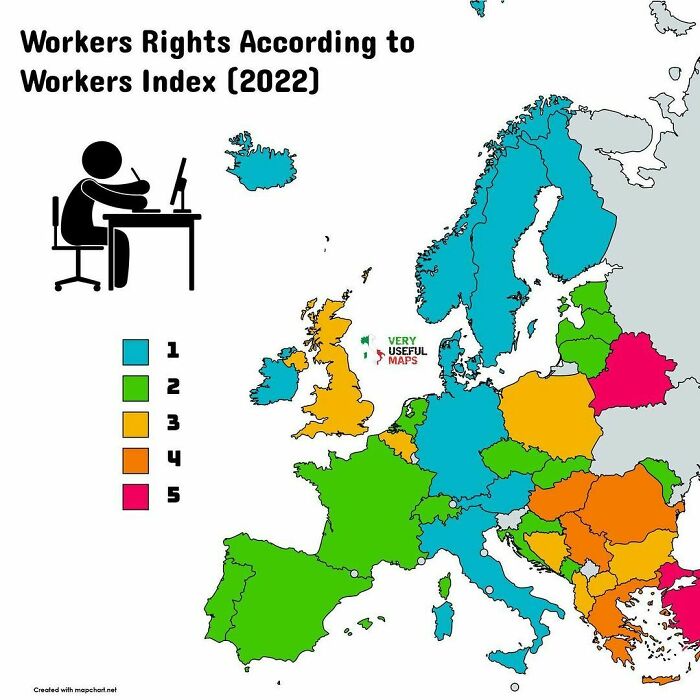
Image credits: very_useful_maps
#100
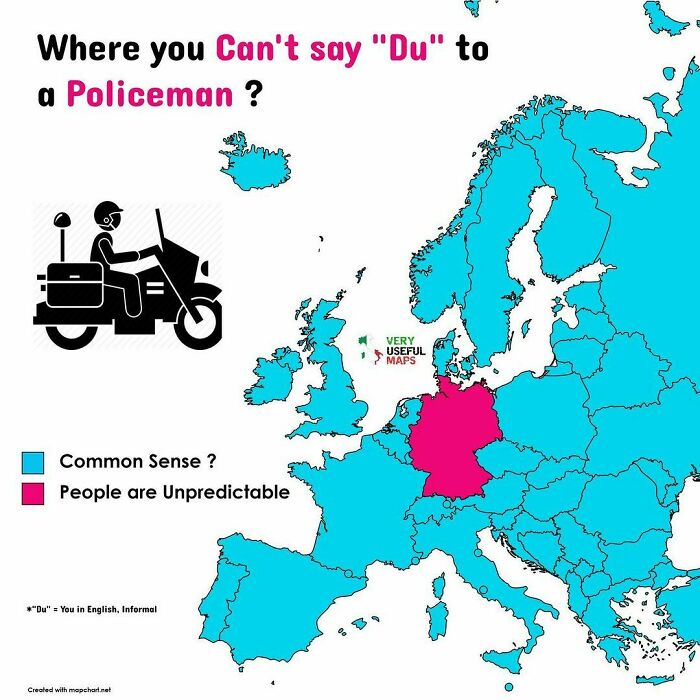
Image credits: very_useful_maps
#101
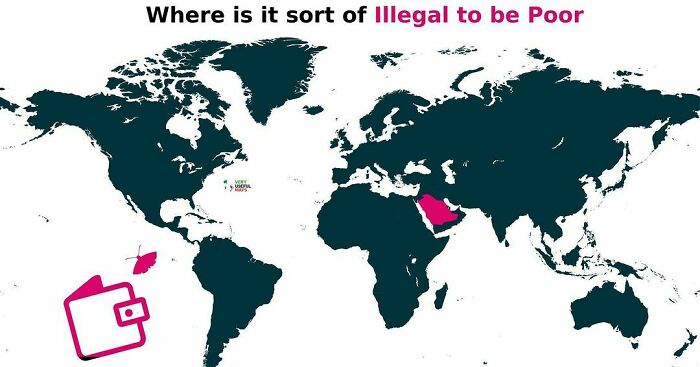
Image credits: very_useful_maps
#102
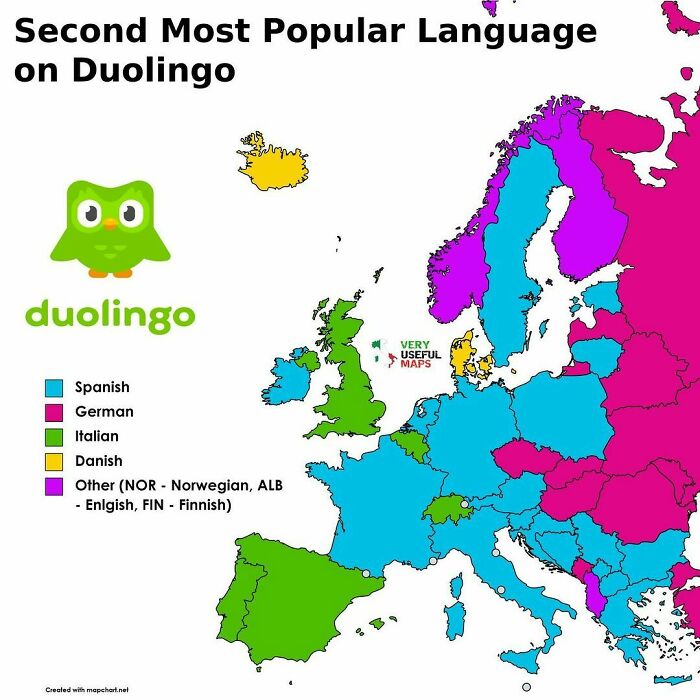
Image credits: very_useful_maps
#103
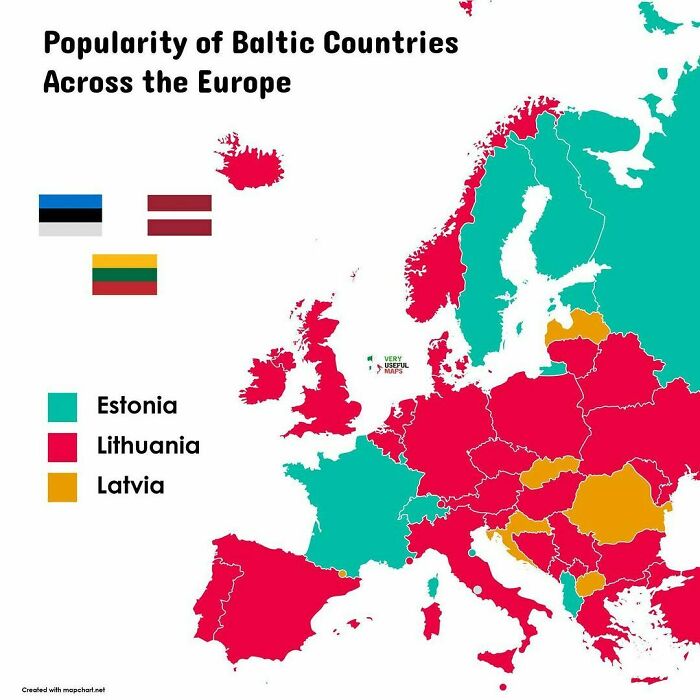
Image credits: very_useful_maps
#104
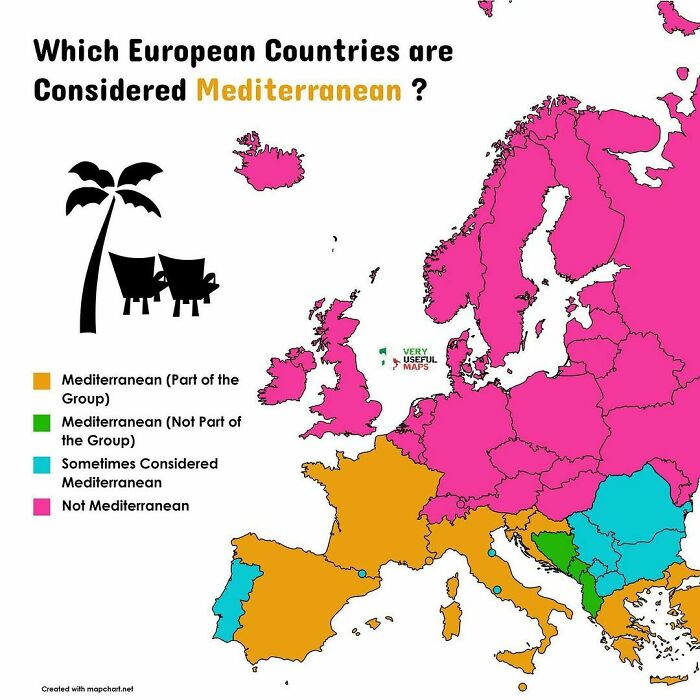
Image credits: very_useful_maps
#105
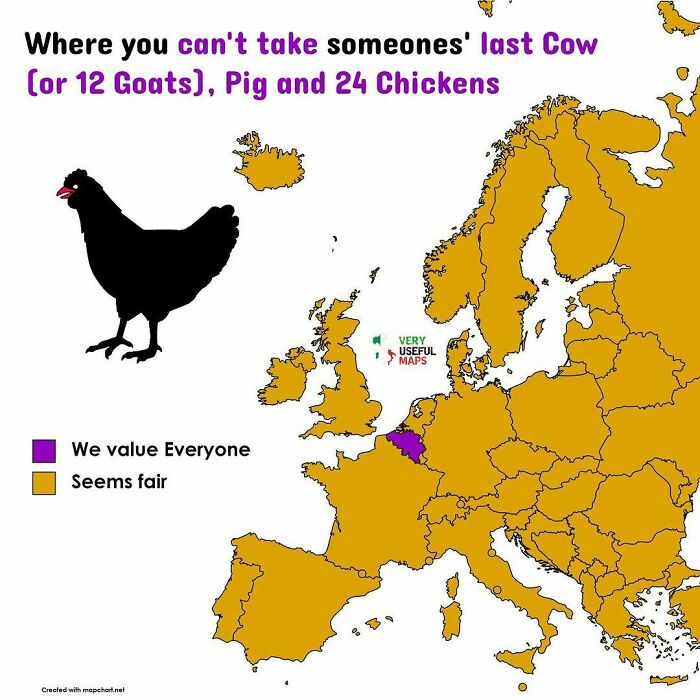
Image credits: very_useful_maps
#106
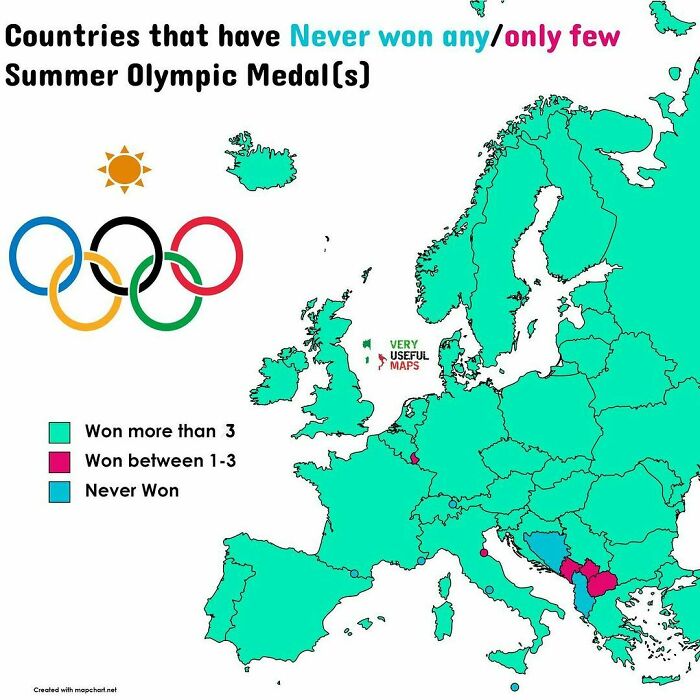
Image credits: very_useful_maps
#107
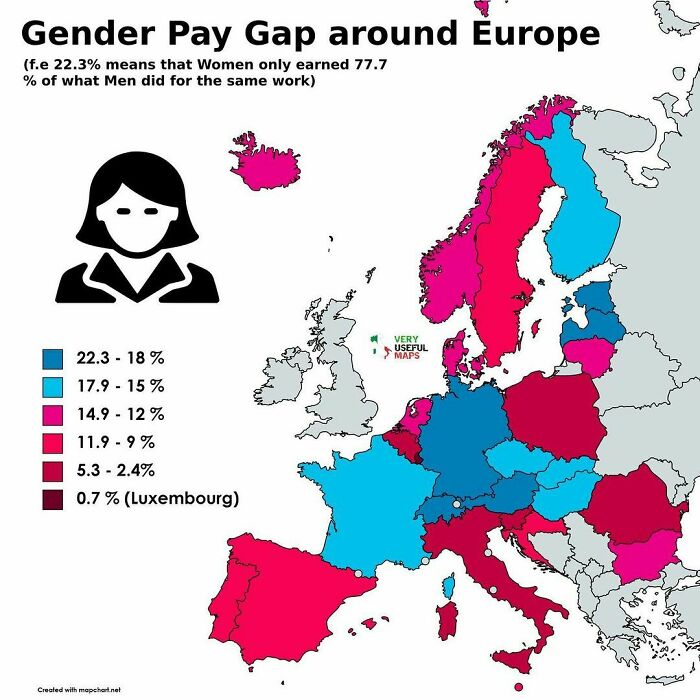
Image credits: very_useful_maps
#108
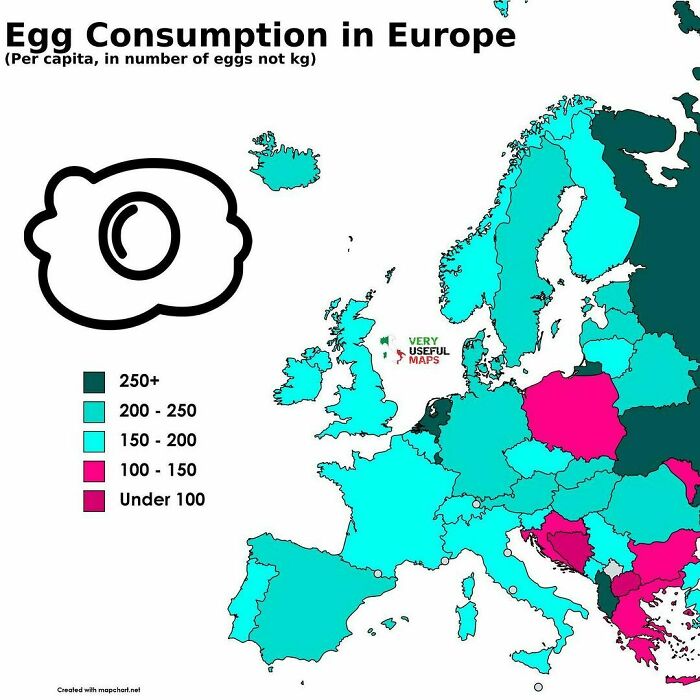
Image credits: very_useful_maps
#109
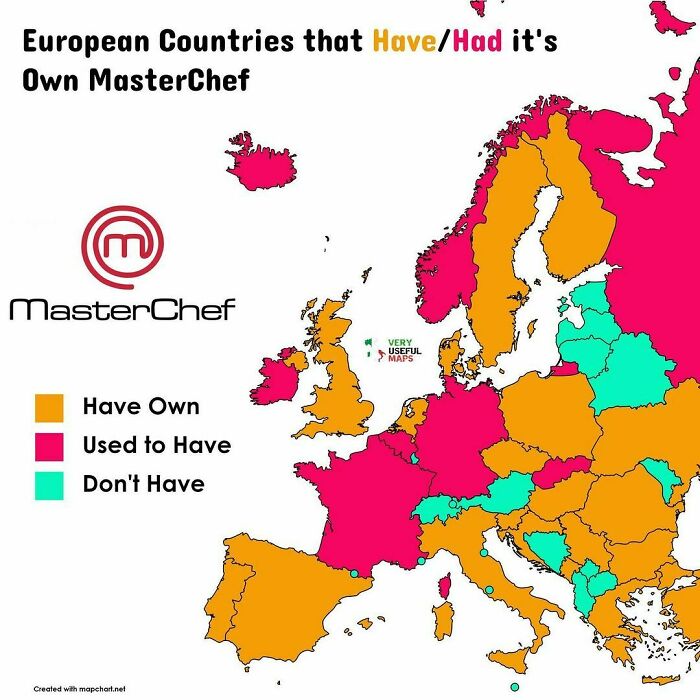
Image credits: very_useful_maps
#110
Image credits: very_useful_maps
#111
Image credits: very_useful_maps
#112
Image credits: very_useful_maps
#113
Image credits: very_useful_maps
#114
Image credits: very_useful_maps
#115
Image credits: very_useful_maps
#116
Image credits: very_useful_maps
#117
Image credits: very_useful_maps
#118
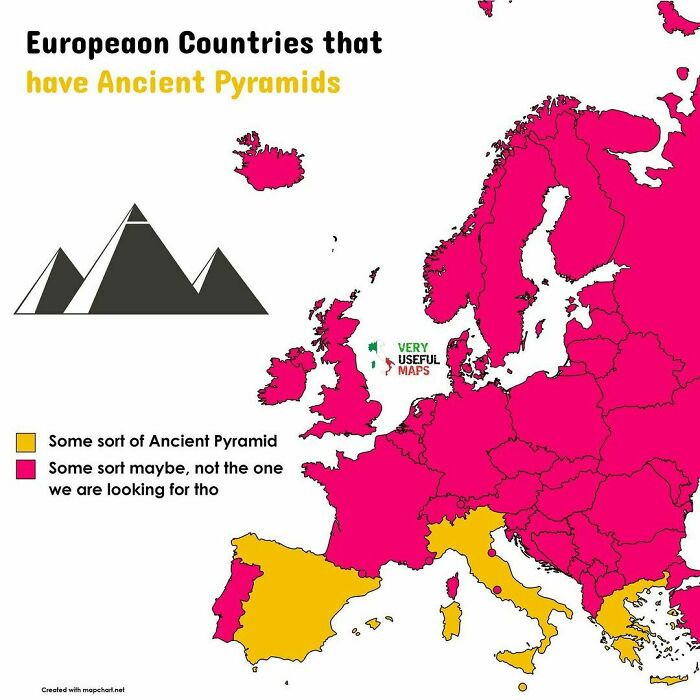
Image credits: very_useful_maps
#119
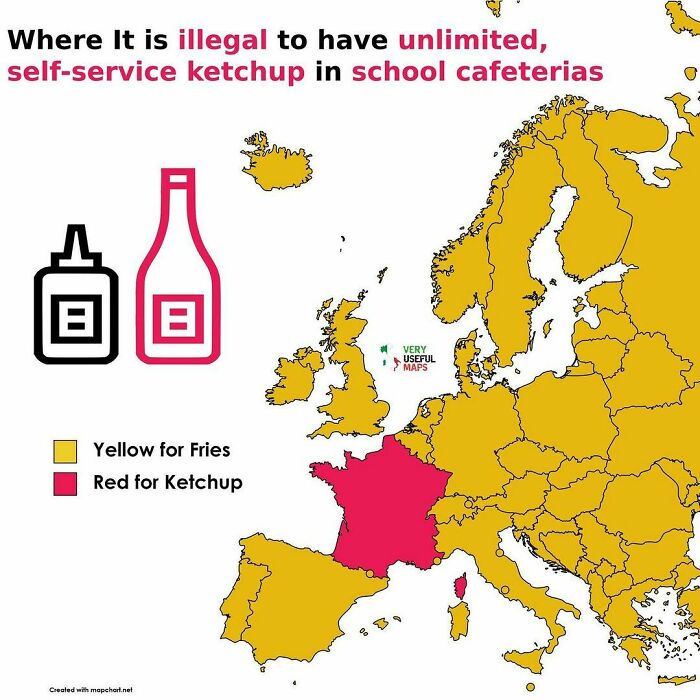
Image credits: very_useful_maps
#120
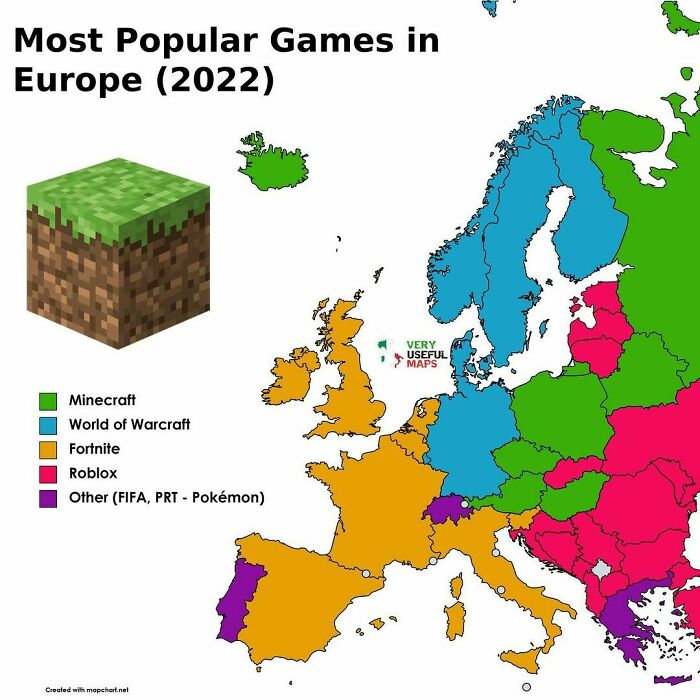
Image credits: very_useful_maps
#121
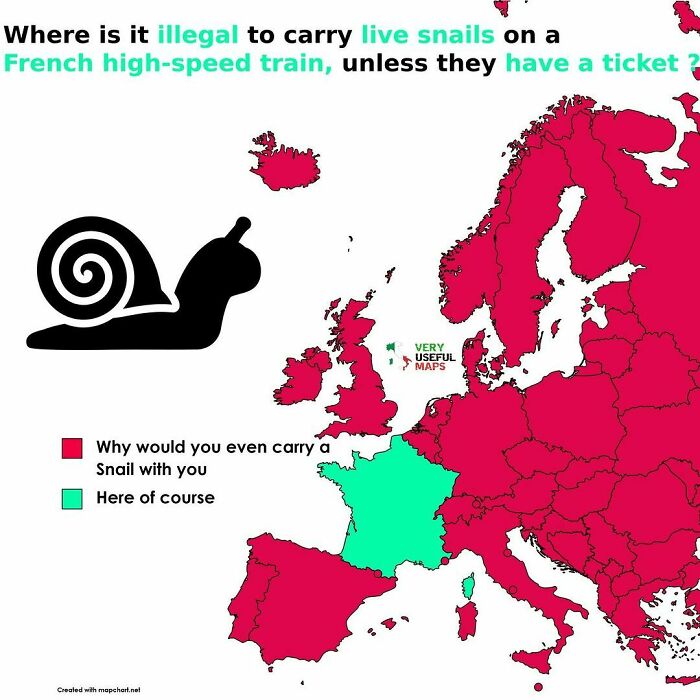
Image credits: very_useful_maps
#122
Image credits: very_useful_maps
#123
Image credits: very_useful_maps
#124
Image credits: very_useful_maps
#125
Image credits: very_useful_maps
#126
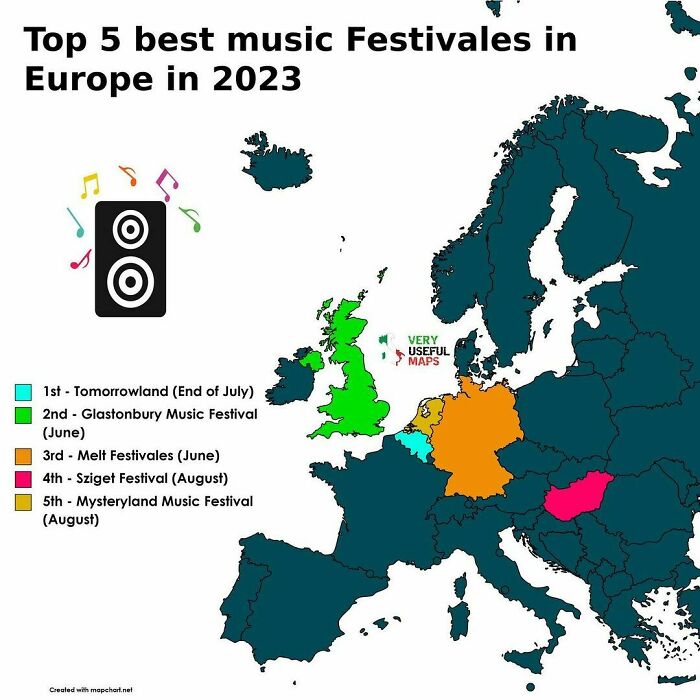
Image credits: very_useful_maps
#127
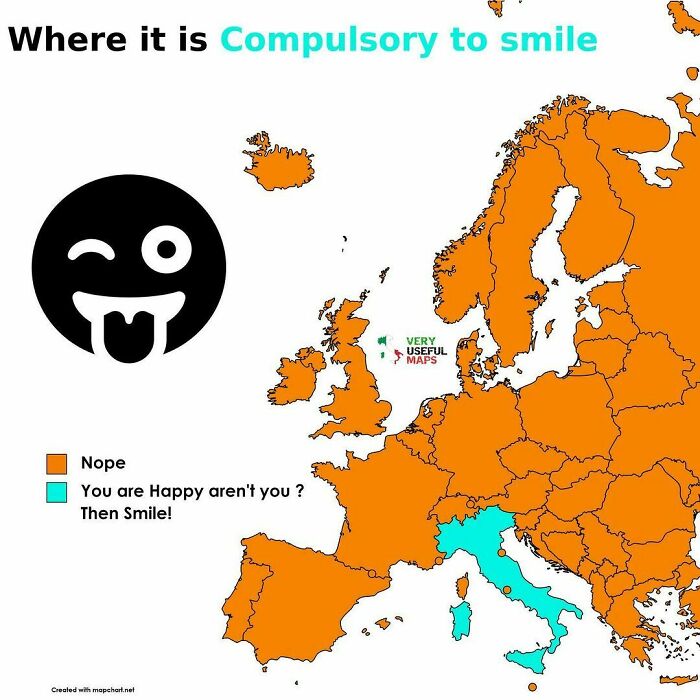
Image credits: very_useful_maps
#128
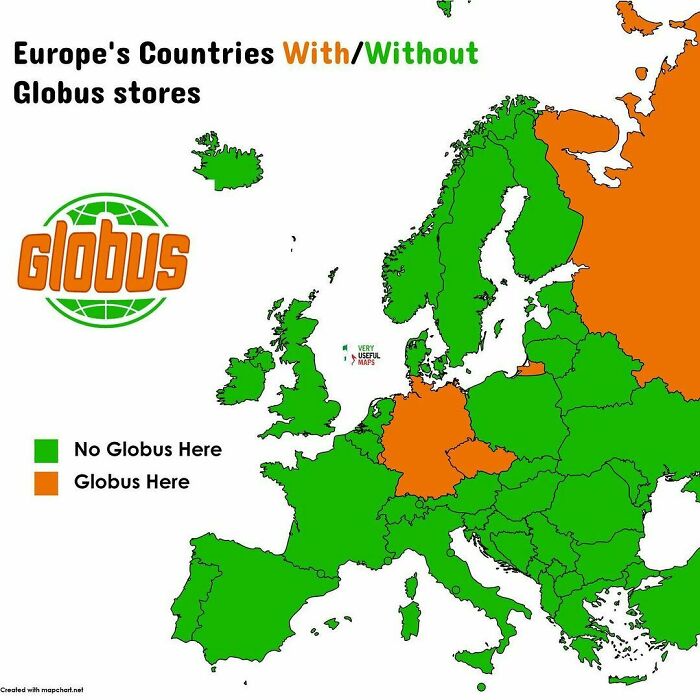
Image credits: very_useful_maps
#129
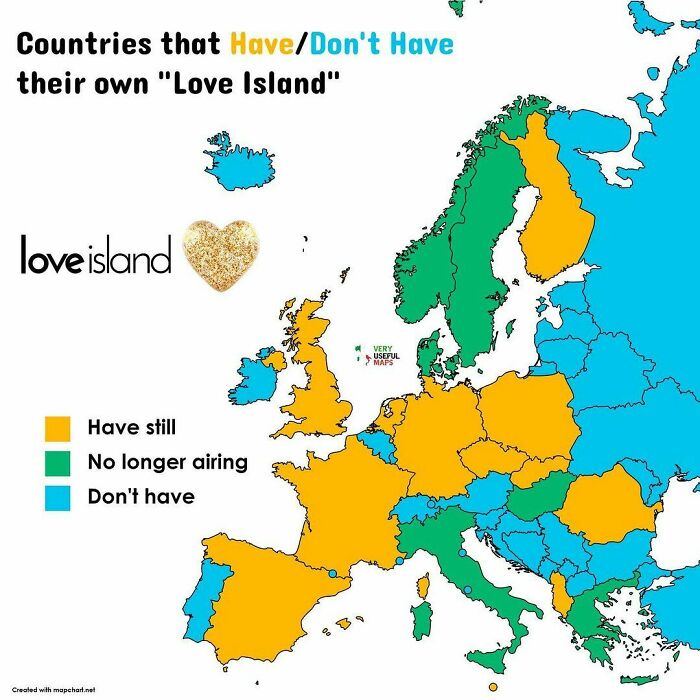
Image credits: very_useful_maps
#130
Image credits: very_useful_maps


